We’d be really interested to read that @evolross, this thread has already been very enlightening. Many thanks for posting everything here.
I’m particularly curious on the database caching. We’ve talked about how to do something along those lines a few times but never went anywhere with it. Are there any purpose built packages that can cache a collection ?
If Meteor really has problems with 40 simultaneous logins, what Is the official statement form the meteor galaxy team. I mean If that would be me, than I would be a pain in the a…
I think if there were an official statement on this, it would be something to the effect that every application is different and will thus need engineering applied in areas specific to their particular architecture and usage patterns to maximize performance.
There are however general areas of concern that can be tackled on all applications and I think the resources touched in this thread cover those pretty well.
I don’t know any packages that can cache a collection but the grapher package offers cached queries (kinda like a Meteor Method that can cache return values). I read the grapher docs and the code behind its caching and it’s very simple.
It’s basically just an object dictionary in server-only code that you store values in. You can use a key/pair or any kind of id/hash to keep various blocks of data separated. If your server restarts, it gets reset, which is fine as it’s just a cache and will get repopulated as soon as the first client needs data.
So if you had a Meteor Method like getChatroomHistory(chatroomId) (oversimplified example), you would create a cache object like var cachedChatroomHistories = {}. Then in that method you would first check if the cache object contains that chatroom’s id (and thus history dataset). If so, get the data from there and return it, if not, query for it, put it in the cache, and return it too. Then after querying you always add a setTimeout to delete and clear out that dataset - a TTL of sorts to keep the data fresh. This works really well and is very simple to implement.
What I’ve found is straight-up Meteor Methods that query the database will always hit Mongo (unlike pub-sub). So if you have 1000 users in a chat and they need the static history that’s non-reactive, if you use a Meteor Method (which is logical) you’re querying the database 1000 times for the same data. If you go pub-sub, which does cache the data for the same query and thus save hits to Mongo, you get all the overhead of pub-sub which you don’t need because the data is static. And I found out one of those bits of overhead is that the Meteor server will duplicate the subscription data for every client on the server because it keeps a copy of the data each client is subscribed too. This may not be a lot of data (as 1KB x 1000 users is only ~1MB of RAM) but it’s just annoying especially if that data is truly static and doesn’t need the benefits of reactive pub-sub. So I’ve found the way to go is Meteor Methods using caches. Again all this is useful when you need to deliver the same data set. Even if it updates frequently, you can save a TON of processor and database calls by caching and polling/recalling the Meteor Method that gets the data to the client.
@xvendo Did you read this thread? I solved the issue. So no need for a statement by MDG.
I am having the same problem with CPU spiking on initial load. The thing is – I am already using Cloudflare and a service worker so nearly none of my clients hit my servers for their assets. I think this problem remains and that adding a CDN probably just kicked that can down the performance road a bit.
My app is highly complex. Each user has ~23 subscriptions, 4 of which are “reactive” in that they depend on data from multiple collections to publish their documents. I publish a few hundred kb to 1M of data per client. I have optimized just about everything I can think of:
All assets served from CDN
Serviceworker caches static assets on client
All collections have indexes as appropriate
I’ve tried both regular oplog and Redis oplog
I’ve got an Nginx load balancer with sticky sessions
Each instance has 1vcpu (Google Kubernetes Engine) and 1.5GB of ram available
I only publish the necessary fields
I try not to use any non-standard meteor packages other than Kadira and synced-cron. I rewrote all of my reactive publications by hand just to remove reactive-publish.
I’m using the latest meteor version
My background jobs (using synced-cron) run on a separate instance that doesn’t serve client traffic
My database has ample overhead
Despite all of this, I see the exact same symptoms as @evolross. If I scale down my number of instances so that > ~55 clients reconnect and start their publications at the same time on one instance then the instance CPU spikes to 100% and hangs there as response time goes through the roof and the instance is eventually killed by my health checker. If an instance survives the initial spike it chugs along happily at 10-20% CPU usage with 50 sessions on it. If it weren’t for the startup spike I could probably handle > 200 users per instance.
I’m running short on ideas. As far as I can tell I’m doing nothing wrong and it is simply the fact that meteor publications are too expensive for a single process to survive > 1000 observers (50 users x 20 pubs) starting at the same time.
I’m considering refactoring parts of my app to use Apollo in an effort to avoid the meteor publication death load but I would love to avoid undertaking that huge project if I don’t have to. Any ideas?
Just as a sanity check - you say you’re using a CDN for “all assets”. Did you follow this article about also serving your Meteor JS bundle via CDN? As that’s the root of the problem of this thread.
Yep, I don’t use meteor build tool. I build my bundles with webpack which gives me a lot more flexibility. I definitely have everything possible cached by service worker and CDN.
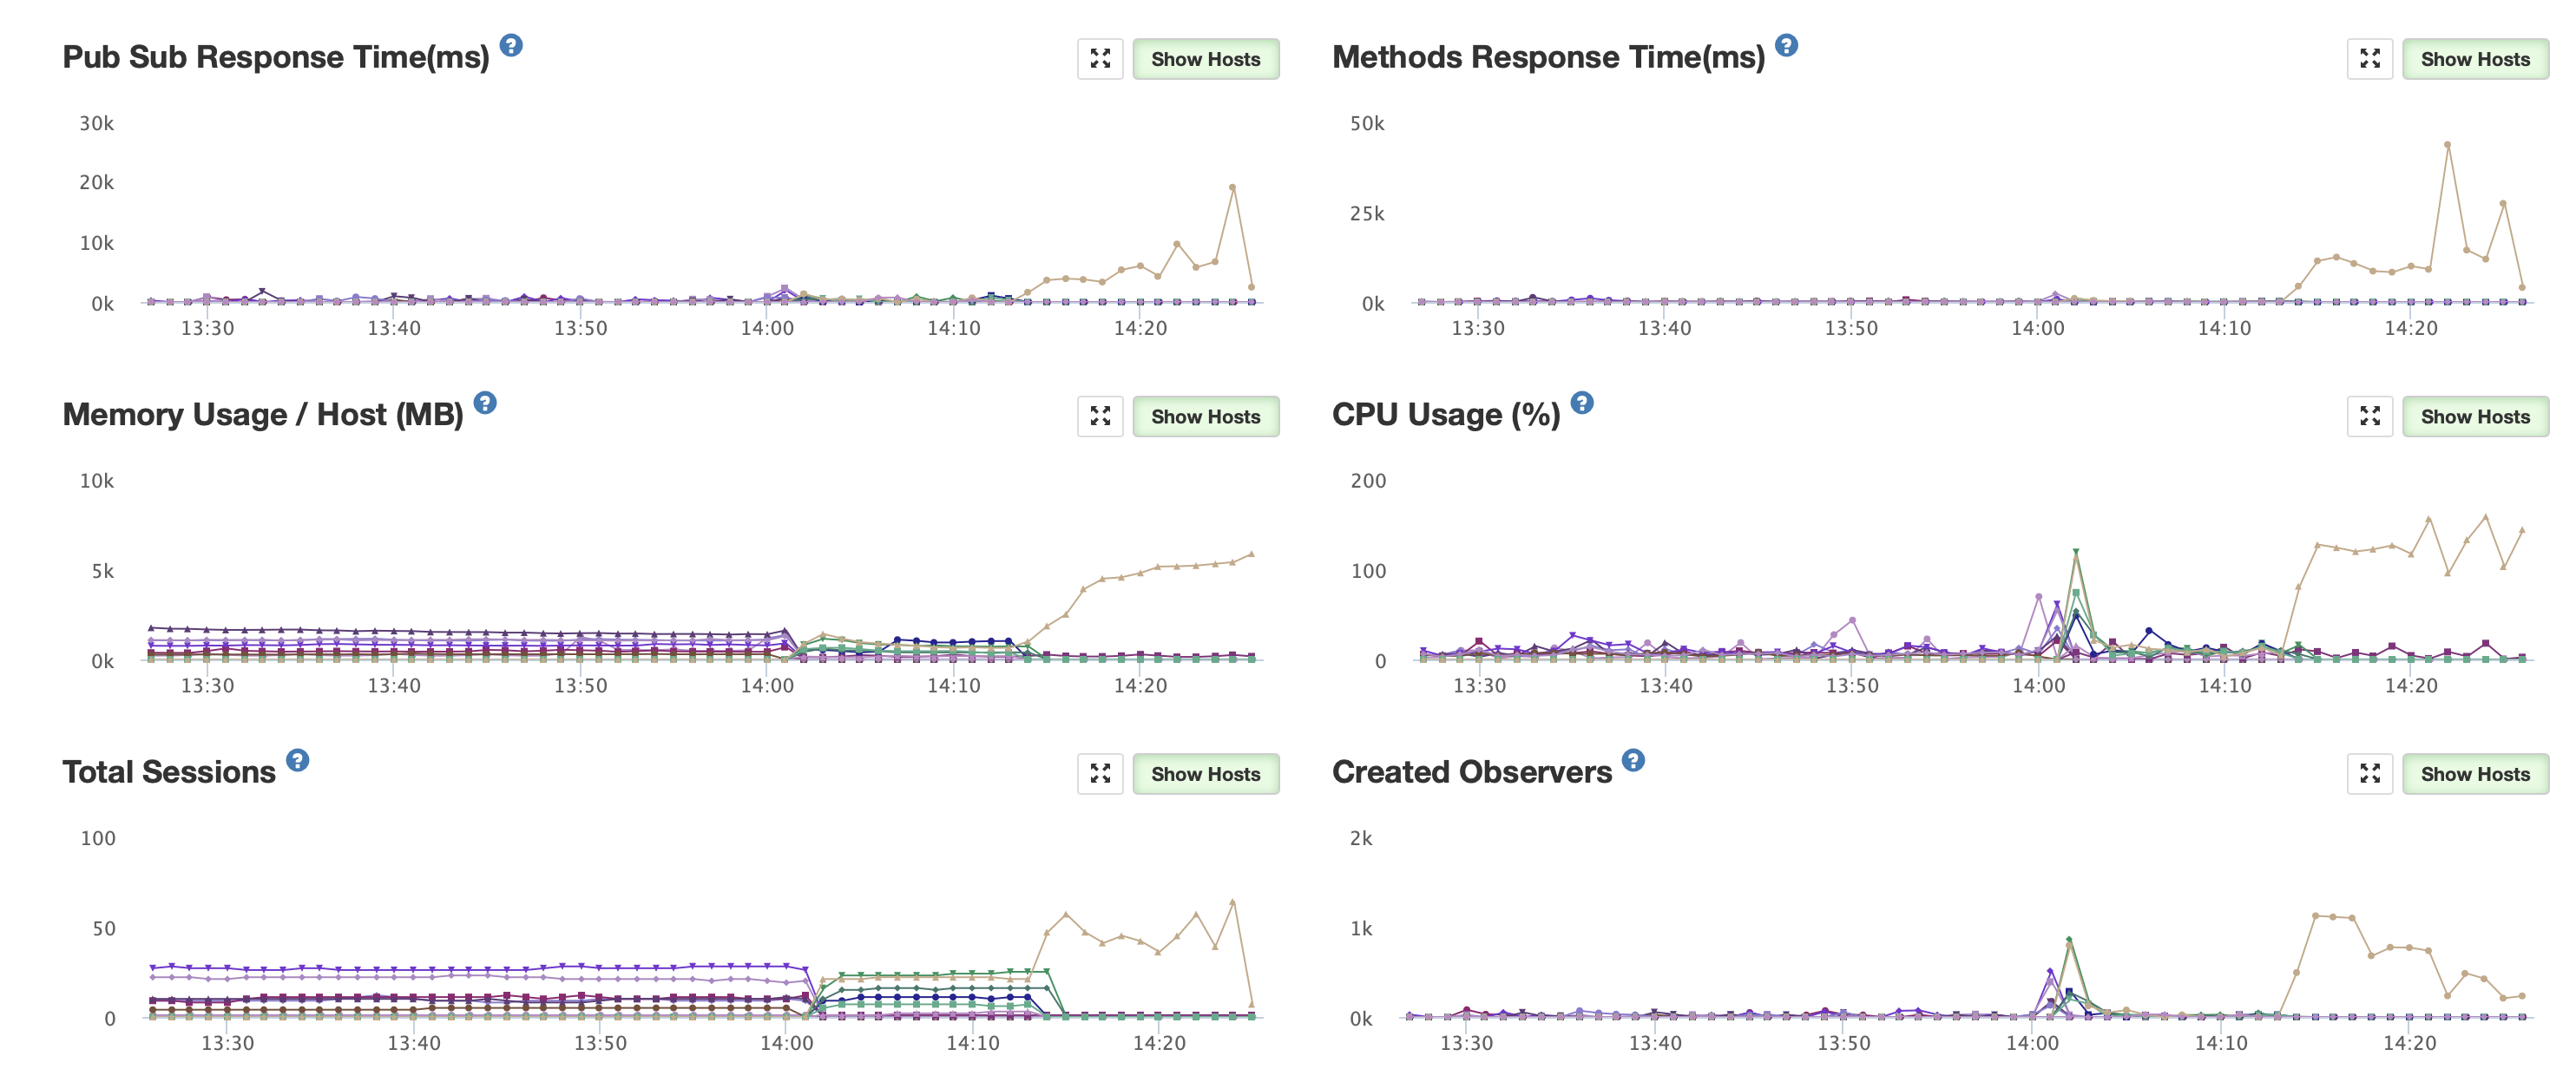
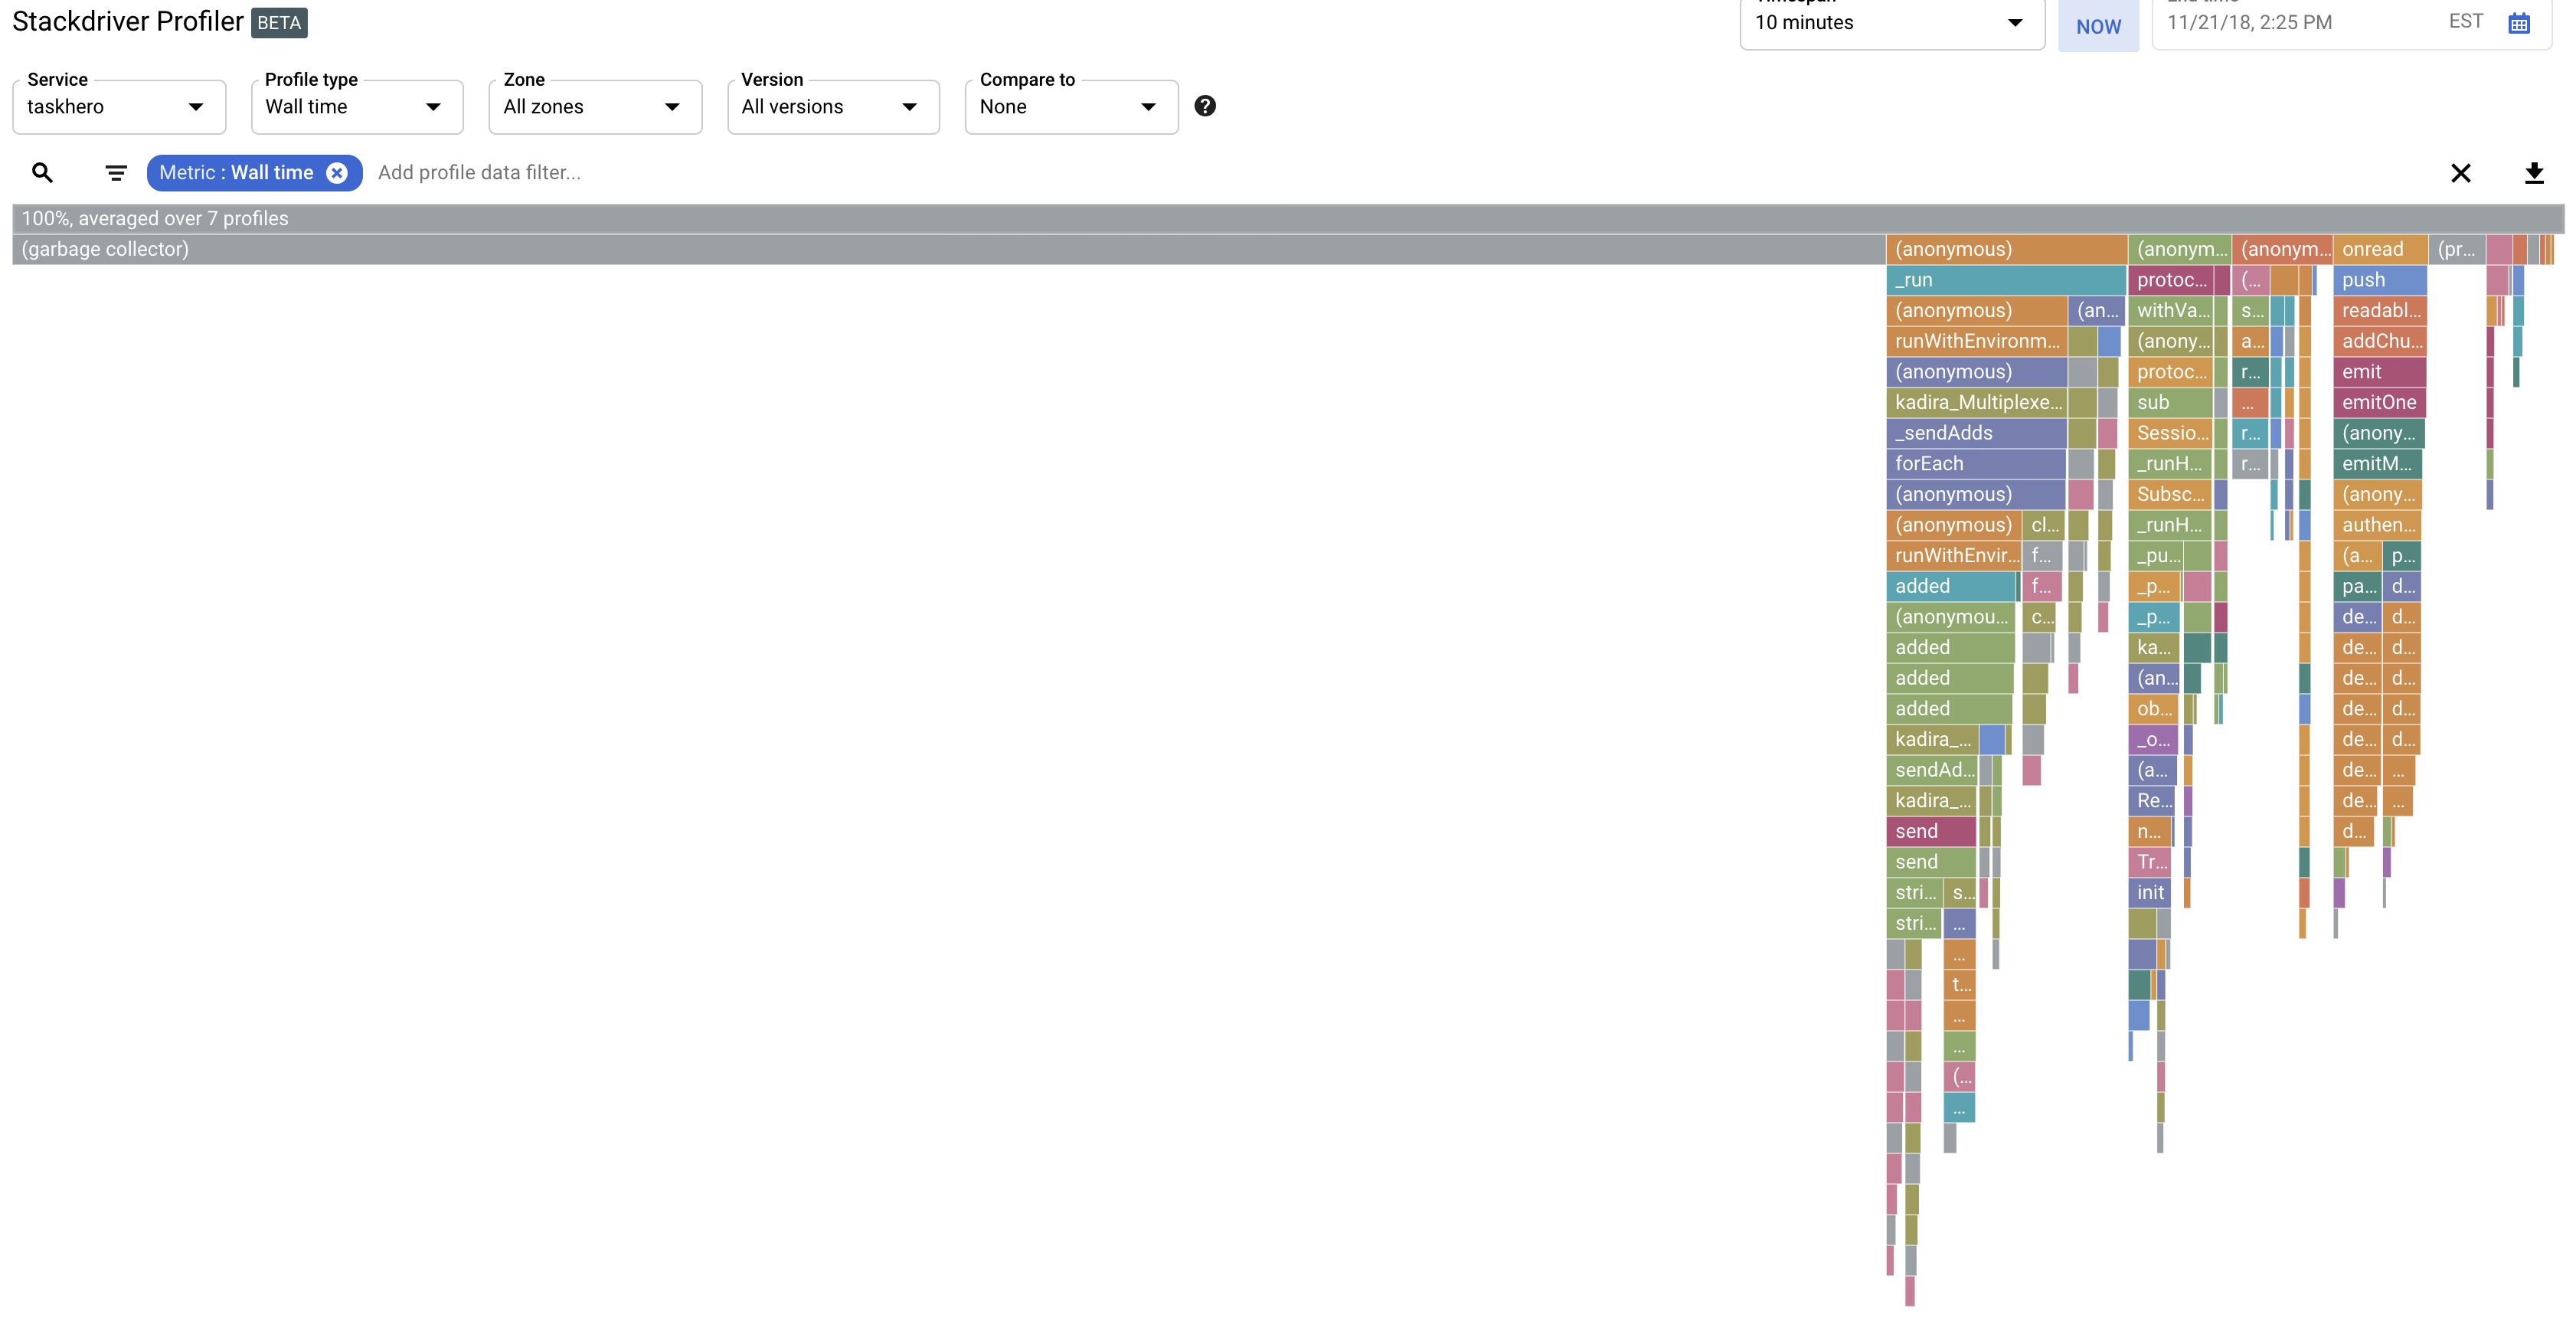
I did a bit of profiling and found that 80% of my time is spent in the garbage collector when my instances get pegged. I also removed the memory limits on my Kubernetes pods and they shot up to 5+gigs of ram with max_old_space_size=4096. It seems like memory usage is way too high when a user connects to my instance. With 50 users and 20 subs per user connecting creating ~1500 observers that seems a little much. Each observer shouldn’t take 3+ megabytes of ram to initialize… should it?
As you can see, nearly 80% of time is in the garbage collector and the memory use of the instance just keeps climbing. Clients constantly get disconnected, requests time out, etc. The strangest thing is that when I have more instances OR if I increase load slowly on one instance this doesn’t happen. This is some sort of loop/spike that only happens when X number of clients try to connect at the same time. If those same clients connect over a period of time there is no problem… Very weird!
There were some garbage collector changes in the latest Node.js versions. This may have something to do with your issues if you’re on Meteor 1.7 or 1.8.
Very interested to hear if you find a good way to fix your problems.
Recently we have shifted one of our client’s app from Meteor Galaxy to AWS. We were using the max size container on Galaxy and still after 800+ Concurrent users - CPU usage was 100% and the app stops responding. Now the app is on AWS and performance is great!
Yeah, I’ve recently moved an app off of a compact Galaxy container and onto a Digital Ocean droplet. On Galaxy I would have CPU spikes between 60 and 80% with just a few users. On the DO droplet the CPU never goes above 10% and it costs me 6X less.
@deligence1@copleykj When switching to AWS, have you found a good solution for horizontal scaling and pushing updates without disruptions to users - basically a similar experience to how Galaxy works? That’s the main reason I stay on Galaxy. It seems like all the other home-brew solutions haven’t solved how to push updates or scale very seamlessly.
We use a custom build of MUP which ties into ELB and takes one instance offline at a time - our plan is to release this version open source soon, but we haven’t been able to test it in the general case.
As far as I know, you can’t avoid kicking users to a different server during deployments - nor the UI refresh that a deployment can trigger.
There is a whole tangle of issues here that I’m slowly working through.
Solved! If a client disconnects from a Meteor server even briefly then Meteor will tear down all of the client’s publications and rebuild them from scratch as soon as the client reconnects. This is very expensive. If you hit a patch of high load and clients exceed the default 15 second heartbeat timeout then they will disconnect and reconnect continually putting more load on your server in an infinite loop until it crashes. I raised the heartbeat interval to 60 seconds and changed my app code so it tries to avoid disconnects as much as possible. This allows big load spikes to avoid going into a death spiral.
Solved? DDP does not rate limit anything except login and signup attempts by default. I (think I) had a client go into an infinite loop of calling an expensive method and it brought down my whole server. A CPU profile revealed one meteor method apparently being called thousands of times in a row. I set up DDPRateLimiter with a catch all rule that clients won’t exceed in normal operation to catch malicious or broken clients.
Not solved. My publications are still using far more memory than they should. Things were running smoothly when I had 3 clients connect and ram usage jumped by nearly 2gb! Not every client causes such a large jump and some of this memory seems to never release (leak). I’m still hacking on this one.
@evolross If you are willing to go down somewhat of a technical rabbit hole you can try a solution similar to the one I’m using.
I’ve ditched the meteor build tool almost entirely in favor of webpack using this as a basis https://github.com/jcoreio/crater. That lets me use pretty much any tooling and techniques without worrying about what Meteor does or does not support. My Meteor server is the bare minimum, I think the only addons I use at this point are Kadira and redis-oplog. Webpack builds all of my client and server code. Meteor build tool only builds the Meteor internal code and plugins. I also use SWPrecacheWebpackPlugin to autogenerate a service worker that keeps my whole app and all its assets cached for my clients.
I run my app in Kubernetes and package it using Helm. This gives me infinite flexibility. It is just a couple lines of yaml to run any needed services such as Redis or a continuous build tool like Concourse. I can run on any cloud provider and can instantly scale to as many or as few instances as I need. An example of this flexibility is my staging deployment. My main deployment uses a hosted mongo service. To spin up a staging environment that also runs its own mongo instance (instead of a hosted one) inside of my cluster was just a couple lines of yaml configuration and 1 command to deploy.
I had to learn a lot of new stuff to get this all running but IMO it beats the pants off of Meteor’s standard tooling and deployment options.