We have a Production ready Meteor app (Angular-Meteor) and are testing it out.
Here’s a little info about our application:
People can create video groups and invite others. They can have a discussion about the video via messages and replies. The Application is hosted in the google app engine with 2GB RAM and 1-3 instances.
When there are around 10 users simultaneously working on a video group, it works fine for the first 5-10mins and then there is a sudden spike of the number of hosts from 10 to 500. I checked this out on Kadira (Monti APM). The app crashes for a good 5-10min. People can still navigate, but they cannot add anything.
Predominant errors are:
[client] Error: Uncaught Error: INVALID_STATE_ERR
[method] Error: You’ve been logged out by the server. Please log in again. [403]
[method] Error: Error, too many requests. Please slow down. You must wait 7 seconds before trying again. [too-many-requests]
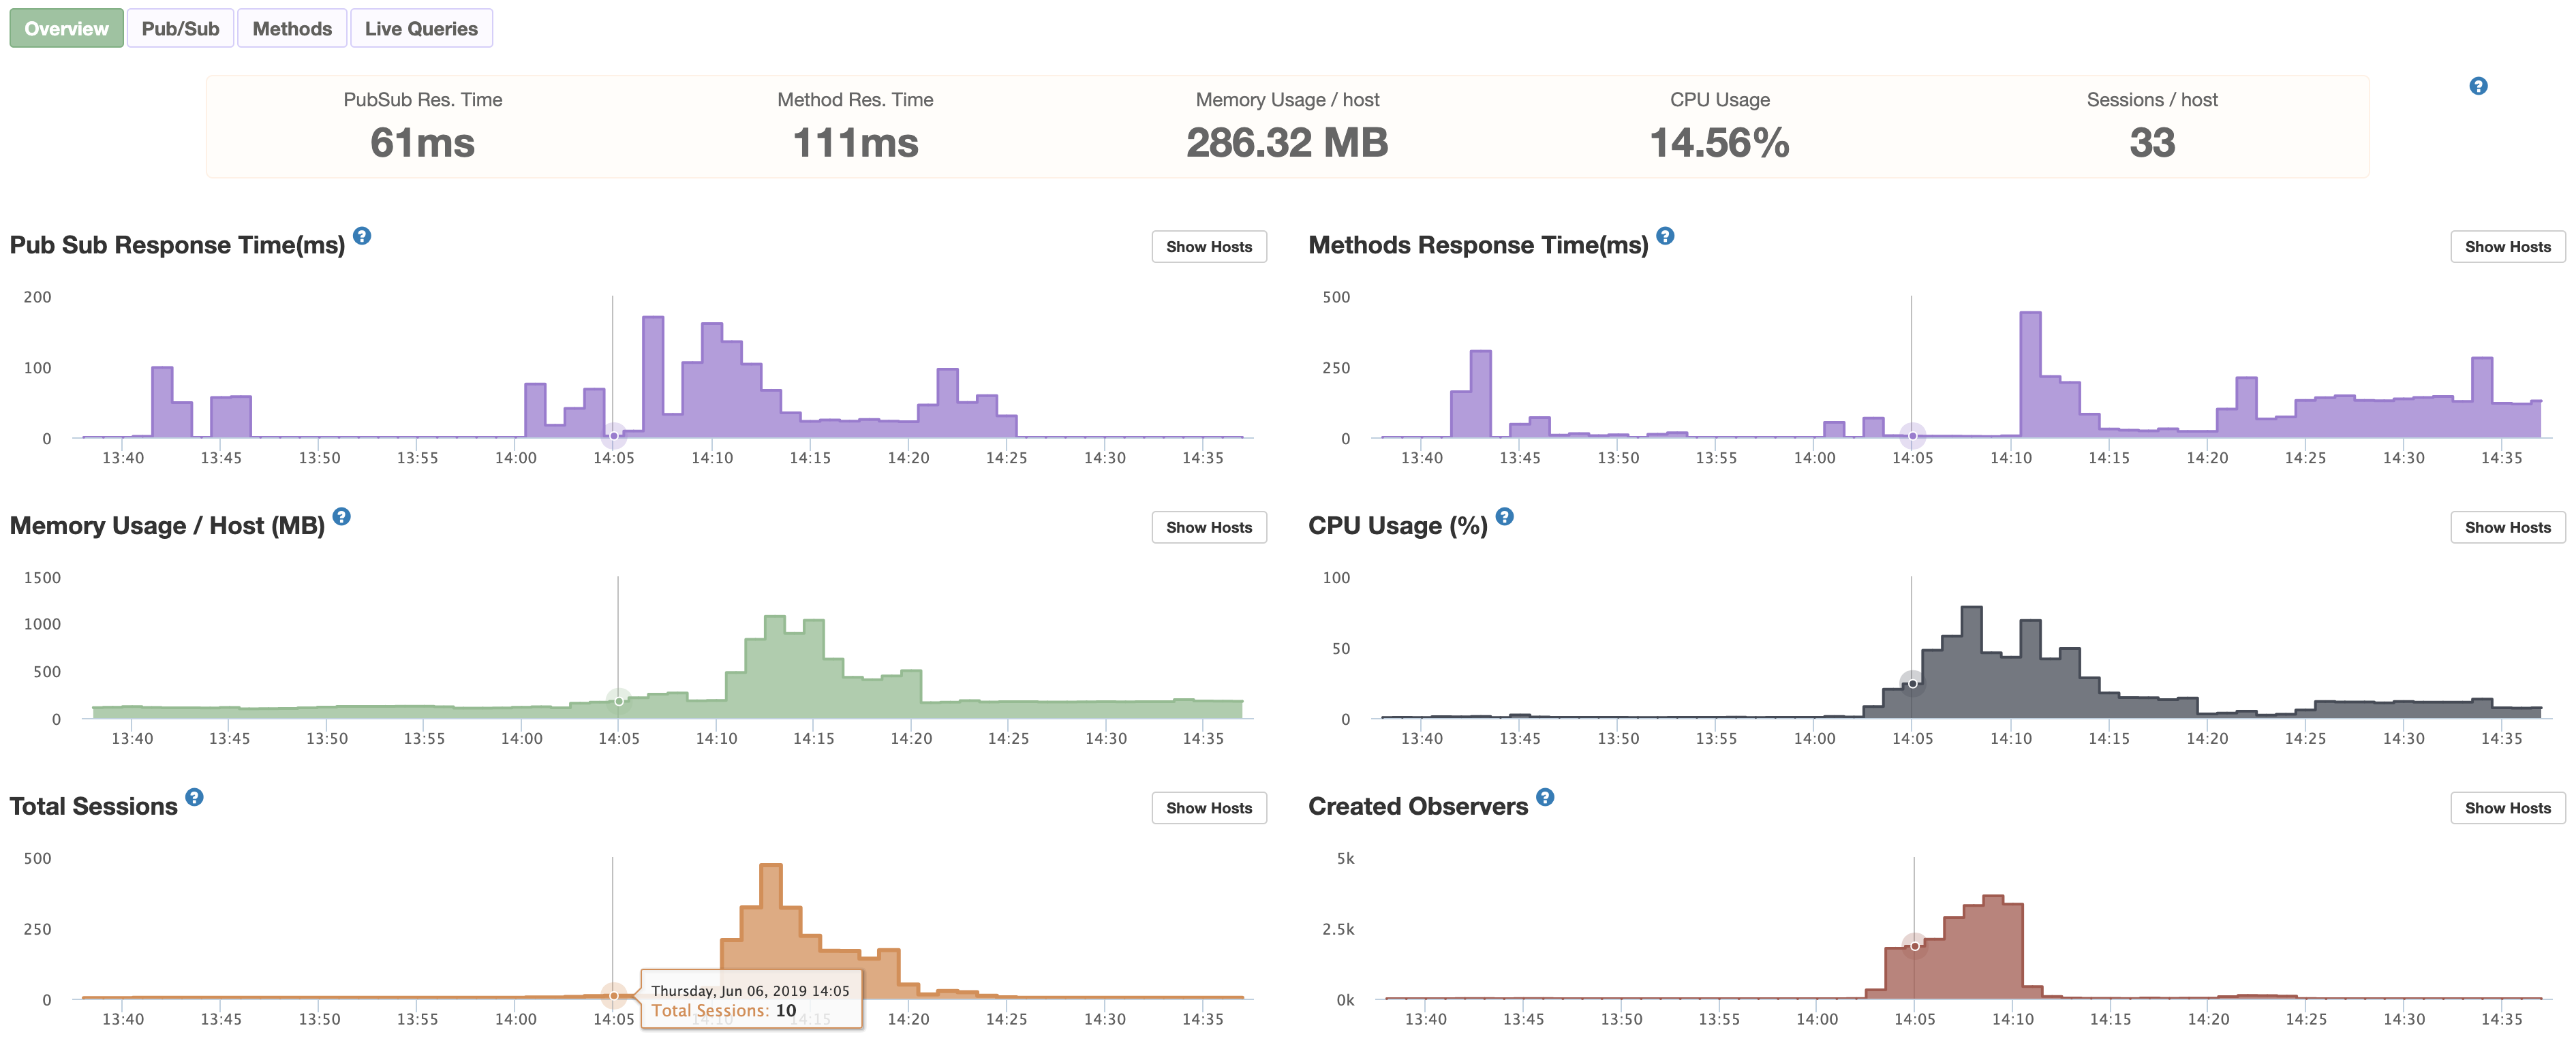
I have added Kadira screenshot. Can someone please help me shed some light on what might be going wrong.
That spike is not the number of hosts, it’s the number of sessions. Kadira is reporting a burst from 10 all the way to 400+ sessions. A quick burst like that could max out the CPU since the server get busy creating those observers for your pub/sub, so it could be CPU bottleneck.
But why those sessions are going up to 400+ if you only expecting 10 users?
It’s really hard to tell. Either the session count from Kadira is off (I’ve personally never experienced that) or there is something really generating that traffic burst to the host.
You’ll need to do some loading testing on a test environment to isolate the issue. To start with, you can deploy a host and just hit with multiple tabs and see how it behaves, 10 users usage is relatively easy to replicate. When I did the load testing I’ve used Google Puppeteer scripts to simulate thousands o session (4k+).
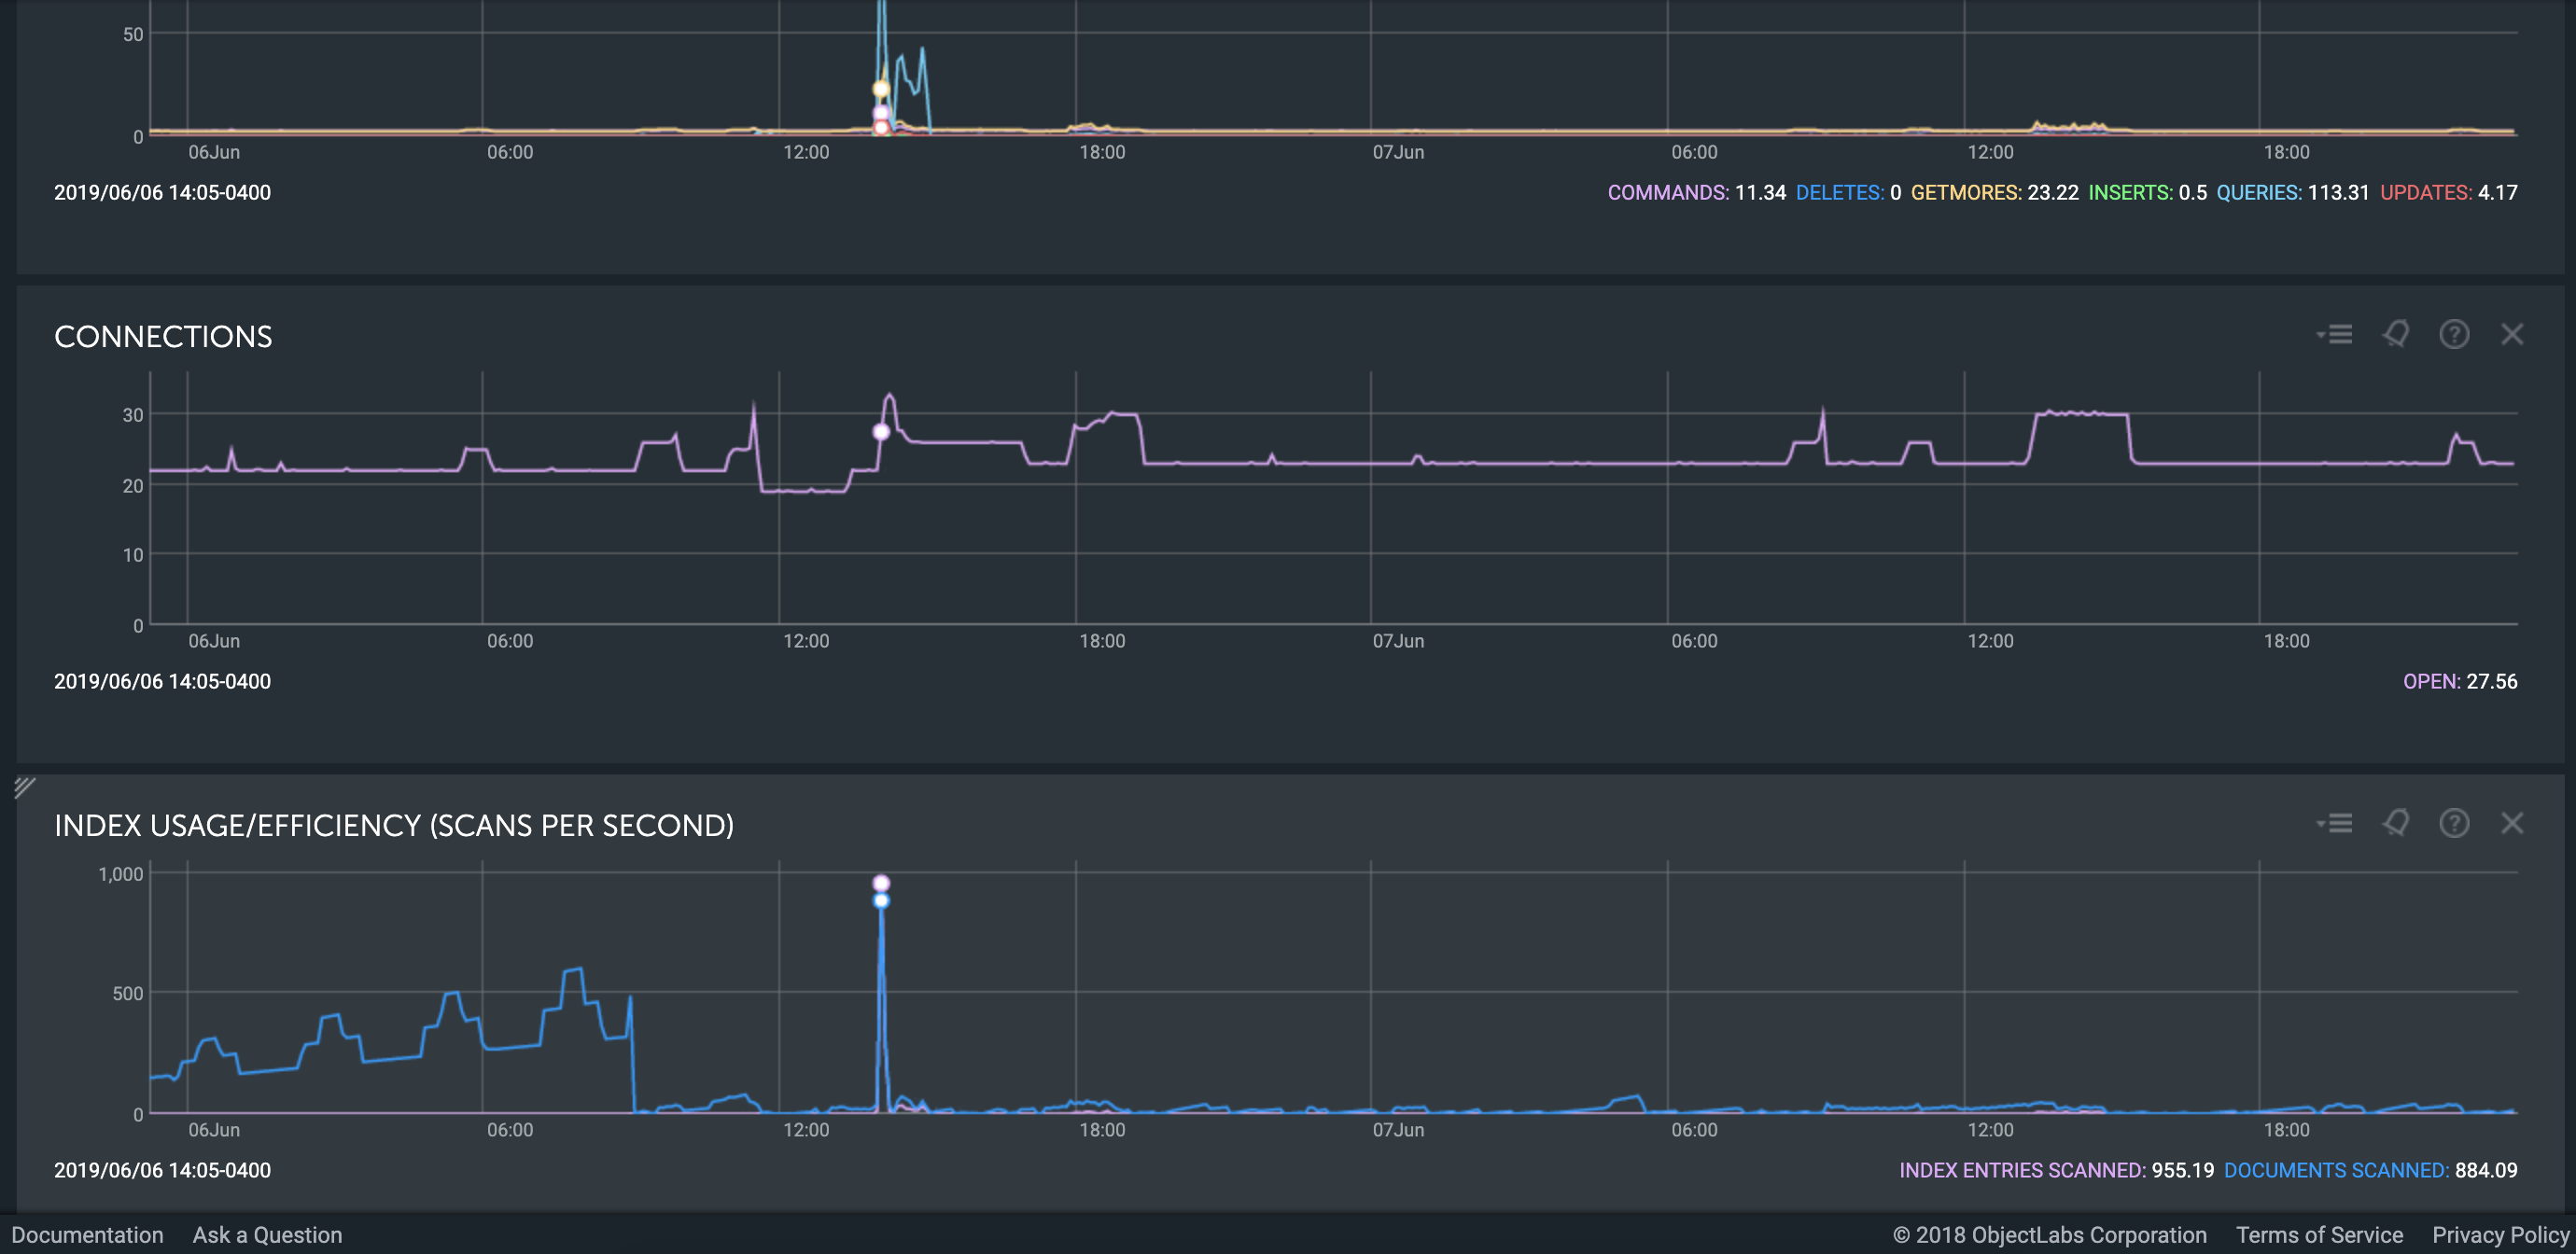
Do you use Mongo Atlas? Or do you have any monitoring tools, graphs for your Mongo? If I was in this situation I would check the number of sessions at the Mongo end too.
I’ve had weird stuff like this happen when I’ve inadvertently created a reactivity loop - change something that kicks off something reactively that changes something that kicks off something reactively etc.
Maybe scan your code for where that could happen near session creation?
To me it looks more like code issues. I feel you have too many observers for those 10 users. In the Methods response time you have a sudden increase of response time but probably as a result of the load due to observers.
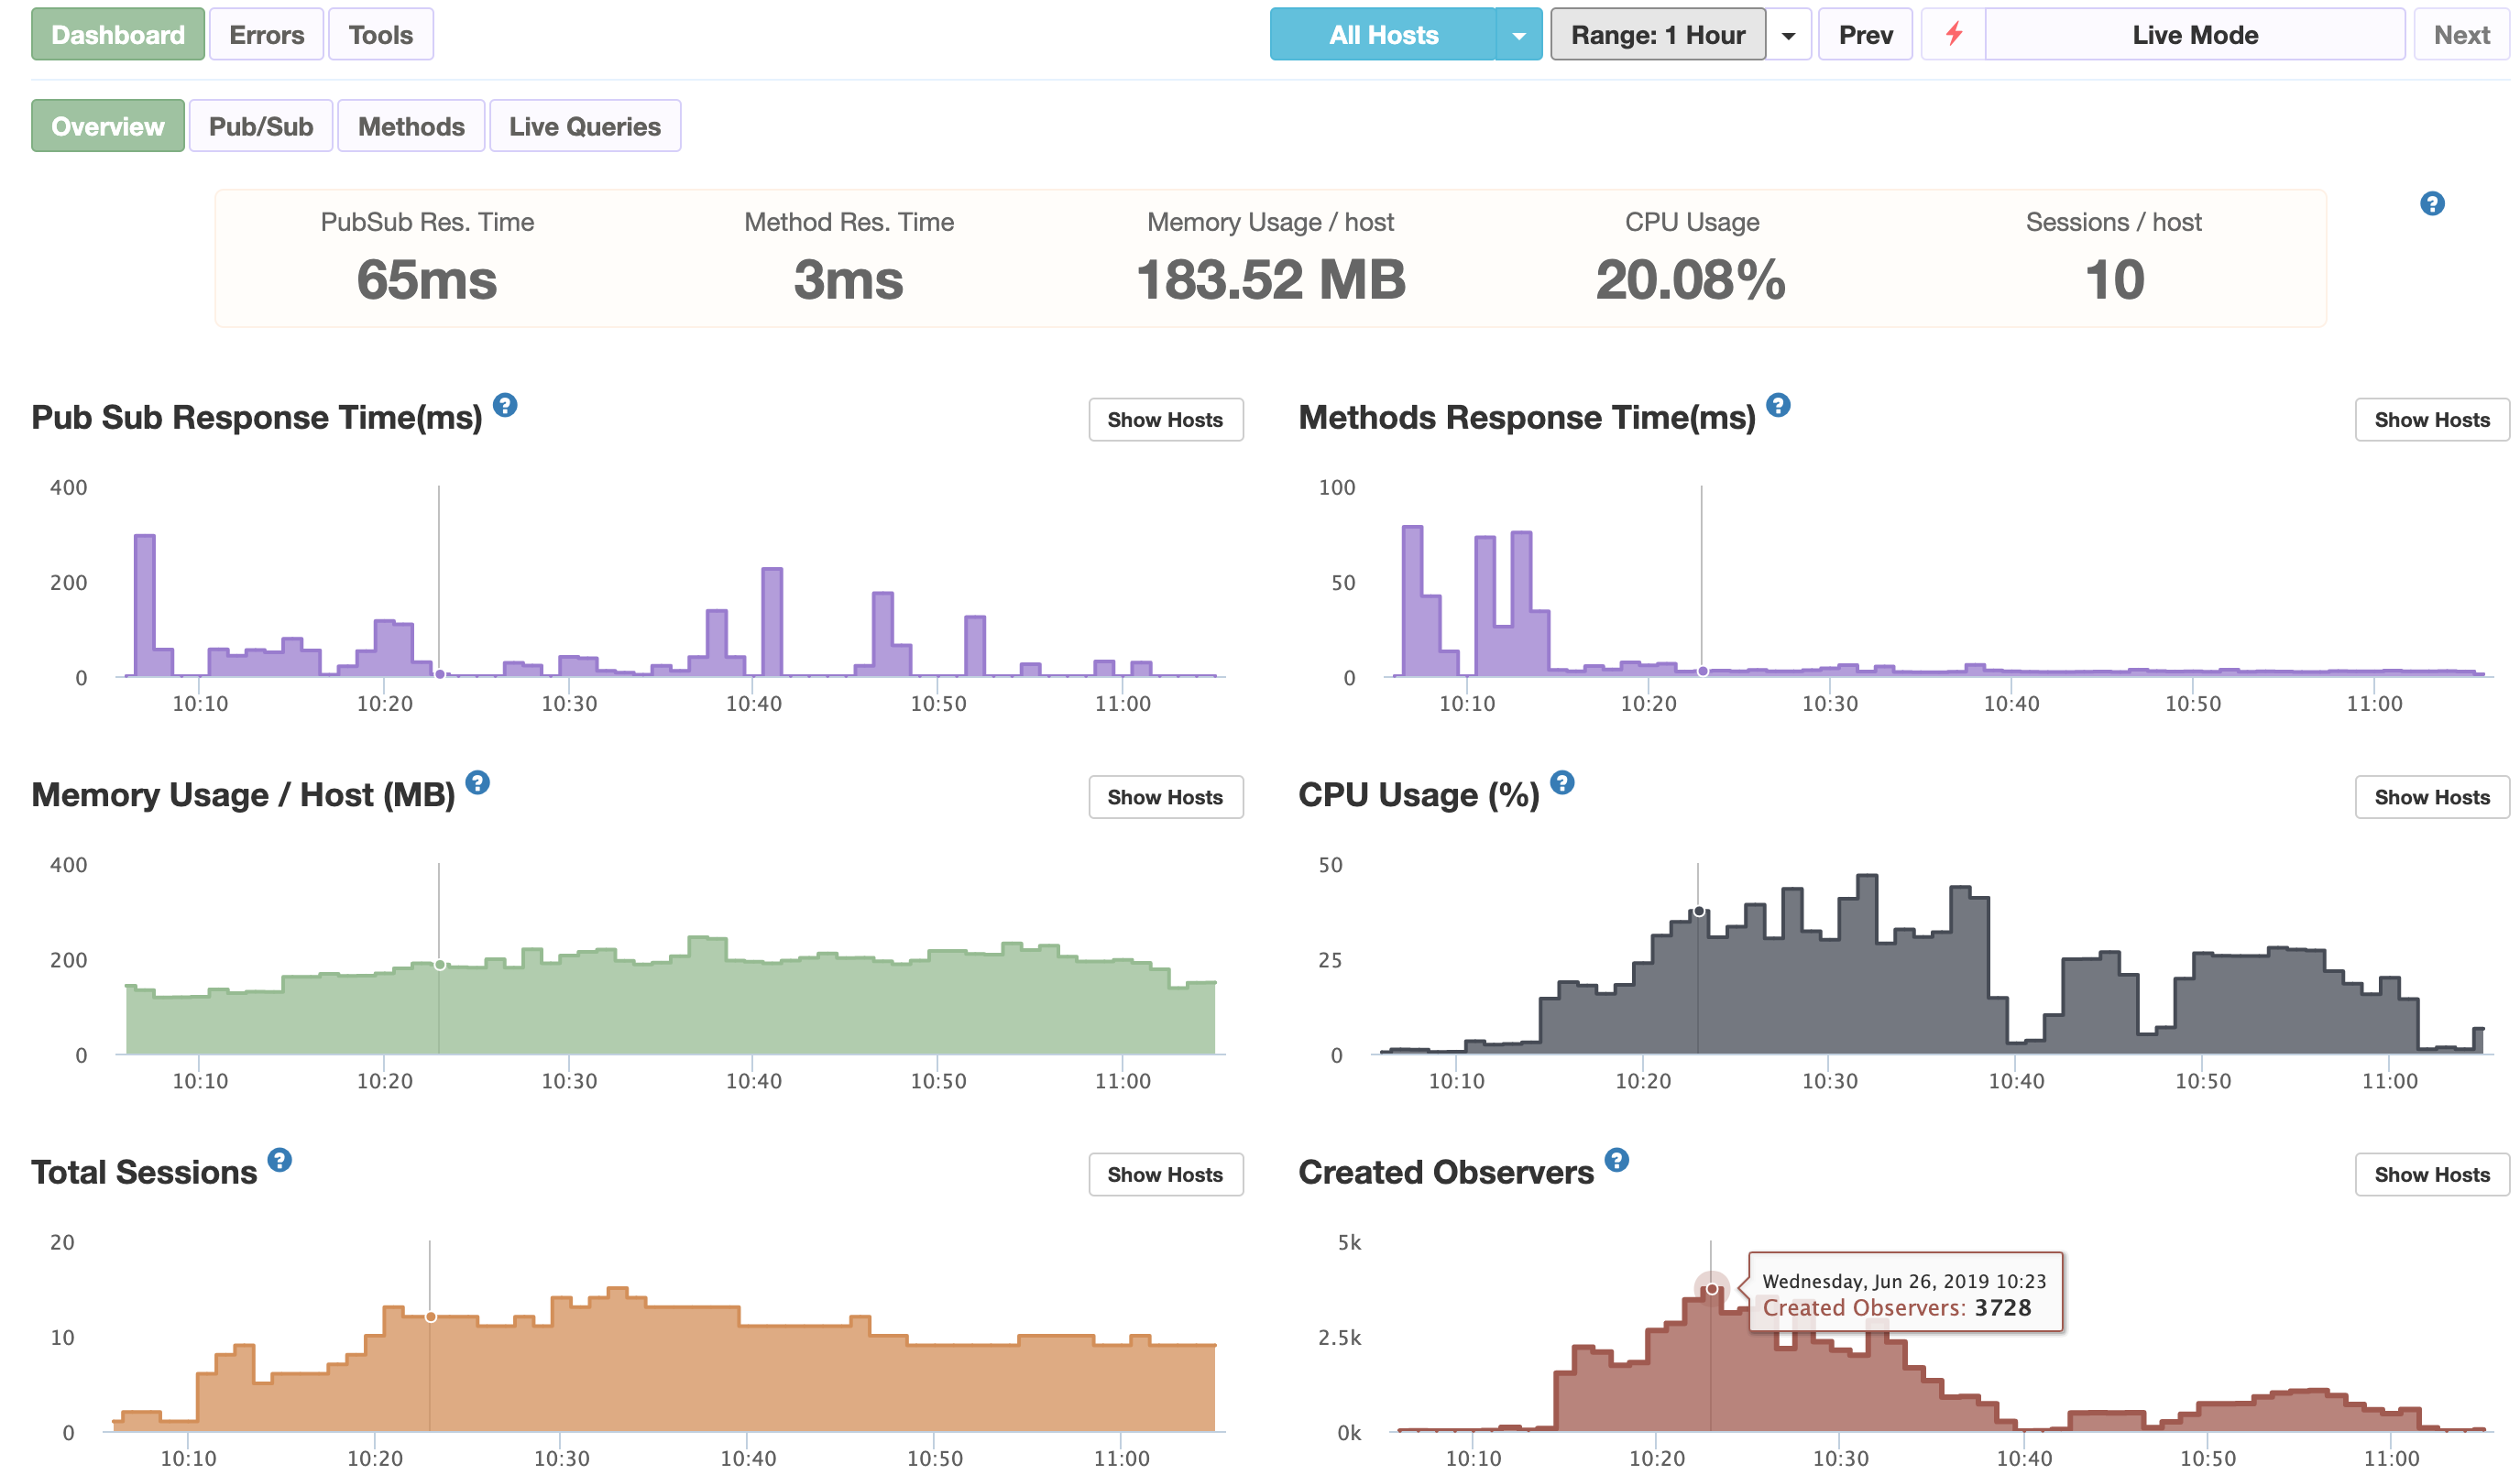
So if your average number of observers per user is 250, I guess your app limit is 10 users :). I think this part of documentation should help you a lot in understanding what is going on, particularly the reusability of observers. https://galaxy-guide.meteor.com/apm-improve-cpu-and-network-usage.html
Well the weird thing about this case is that it’s not only the number of observers that is jumping but also the number of sessions. It seems something was hitting the server and creating more socket connections and from @srman comment above, it could be related to App Engine Scaling.
I felt that number was too high from the beginning.
How many documents you have in Live Queries / Fetched Documents.
Then you can check in Pub/Sub with a filter on Low Observer Reuse. If your Low reuse is big, in Meteor.com you can find all documentation in APM on how to reuse these more.
For the fetched documents you would probably need to use pagination if you get more than “a screen size”.
You would ideally have indexes on Collections for every query published. Example: if you get documents created by a user and contain a tag, add an index to the Collection for _id, userId and tag. Best practices say that every method or publications should be covered by proper indexing on the collection.