Using visual studio code for meteor development

VS Code March release brought some interesting features. I had been looking for some editor which would give good intellisense and debugging. Node inspector is pathetic when debugging applications compared to what is available in java, .net and other languages. Webstorm is a good one but is a resource hog and expensive.

Intellisense work amazingly great with VSCode at least when you use Meteor 1.3. It now understands es6 modules and provides full intellisense for your own es6 modules. It still does not work with imports from meteor packages. I did not configure it for outside libraries but for my own modules in the project it works like a charm. Just configure jsconfig.json and you are good to go. Refactoring works nicely with it. I can say it provide the best Intellisense among the many editors i tried like sublime, atom etc.

Here is my jsconfig.json
{
ā€œcompilerOptionsā€: {
ā€œtargetā€: ā€œES6ā€,
ā€œmoduleā€: ā€œes6ā€
},
ā€œexcludeā€: [
ā€œnode_modulesā€,
".meteor",
".gagarin"
],
ā€œfilesā€: [
ā€œclient/",
"server/
ā€,
ā€œlib/*ā€
]
}

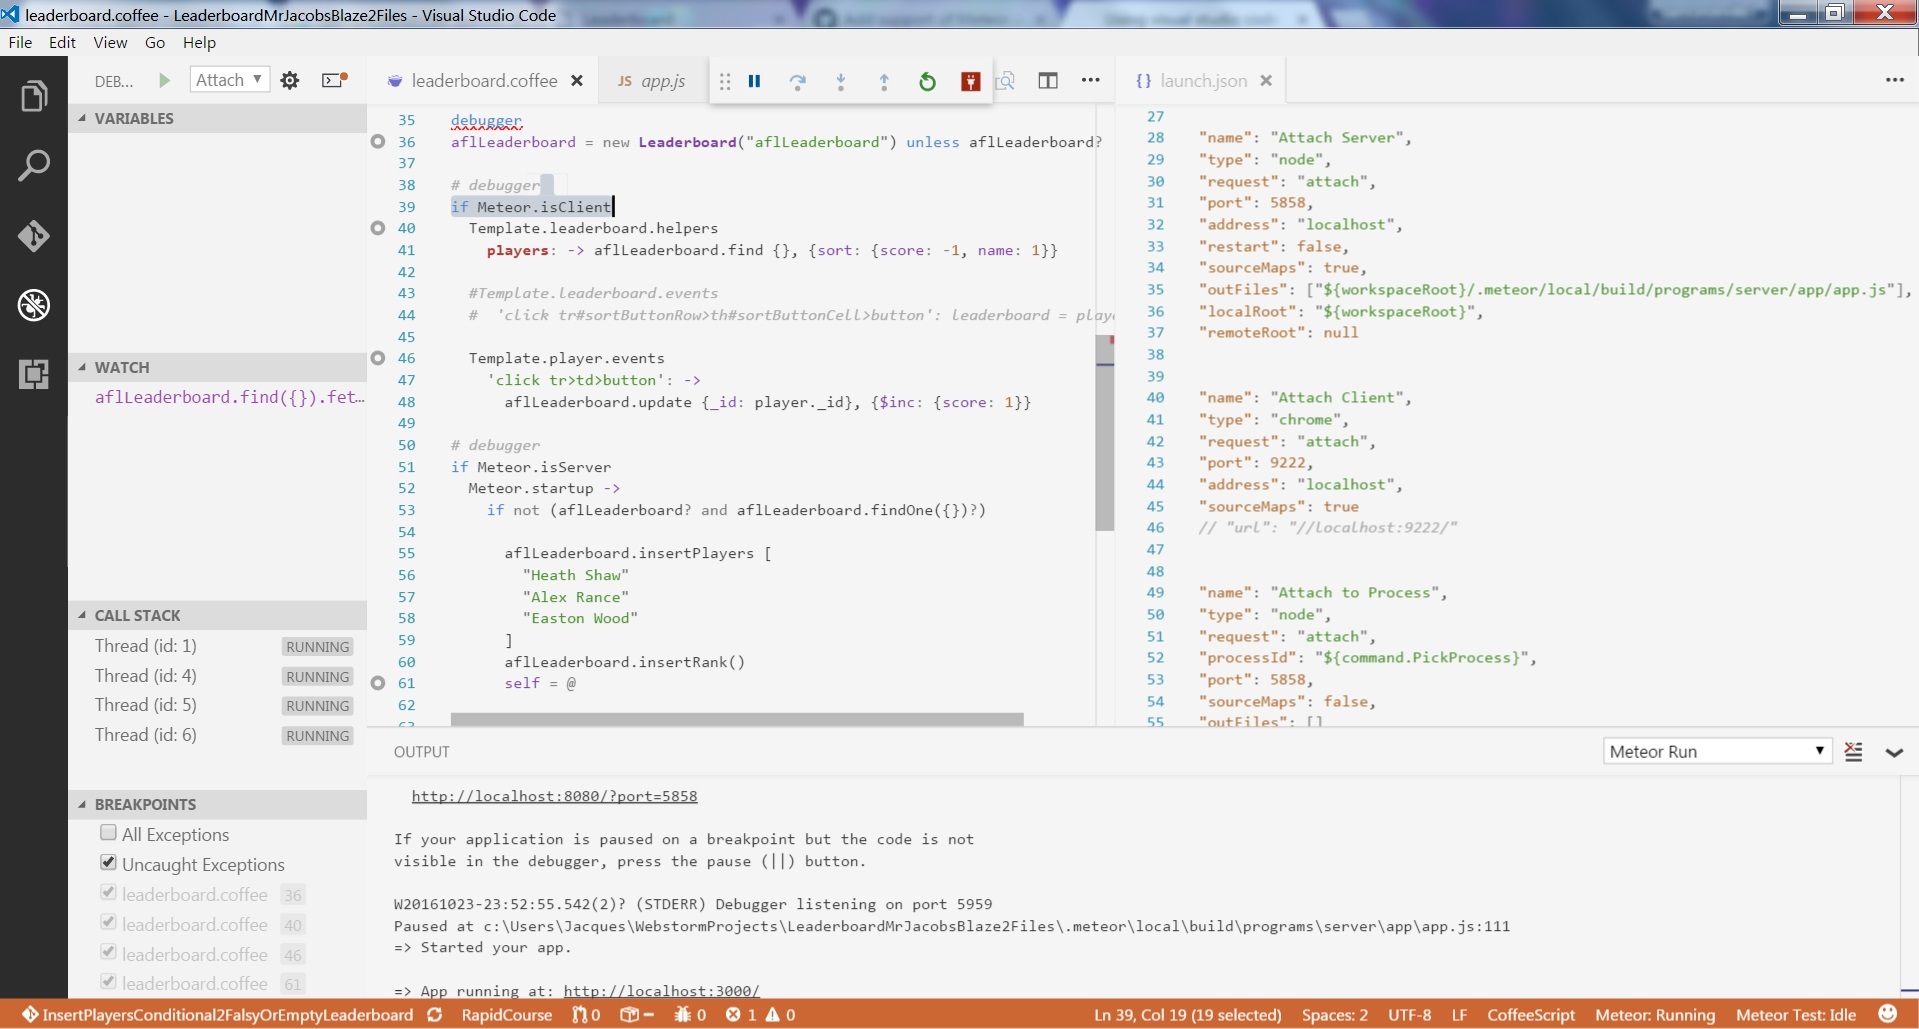
VS Code offer debugging node applications as well. I tried it with meteor but was not able to debug using the launch configuration. The only way i was able to debug meteor application on the server side was to run meteor as ā€˜meteor debugā€™ and than use the attach configuration to attach with the process to debug. I had to alter launch.json file a little and voila i was able to debug inside VSCode and it works amazingly nice. I was able to debug anonymous function and all without a hiccup. Watches and stacks all works nicely.

Here is the example of my launch.json

{
	"version": "0.2.0",
	"configurations": [
		{
			"name": "Launch",
			"type": "node",
			"request": "launch",
			"program": "${workspaceRoot}/server/main.js",
			"stopOnEntry": false,
			"args": [],
			"cwd": "${workspaceRoot}/server/",
			"preLaunchTask": null,
			"runtimeExecutable": null,
			"runtimeArgs": [
				"--nolazy"
			],
			"env": {
				"NODE_ENV": "development"
			},
			"externalConsole": false,
			"sourceMaps": false,
			"outDir": null
		},
		{
			"name": "Attach",
			"type": "node",
			"request": "attach",
			"port": 5858,
			"address": "localhost",
			"restart": false,
			"sourceMaps": true,
			"outDir": "${workspaceRoot}/.meteor/local/build/programs/server",
			"localRoot": "${workspaceRoot}",
			"remoteRoot": null
		}
	]
}

The first configuration does not work but the second one does using attach.

Please share your experiences if you have tried VSCode. Are there better ways to debug or use intellisense in VSCode than what i have described? If yes please do share so that everybody benefits. VSCode is a fantastic editor and it can become ideal for meteor.

Thanks

11 Likes

Iā€™ve heard nothing but good things about VSCode but every time I try it, it just doesnā€™t click with me. I donā€™t know why.

@suhaila Iā€™ve been trying to do server side debugging with VS Code and I canā€™t seem to get it to work with either launch or attach configurations. Iā€™ve borrowed your launch.json config but I still donā€™t seem to be able to attach to a running meteor debug process.

Is there anything else you had to do to get it working?

Well here are my steps

Run meteor debug
Once it starts then wait till it shows that it is on a breakpoint
Then on vs code click attach. It will go on a break point where meteor debug is stuck. Source map is important though

I am using Linux mint 64 bits but it works on Windows 10 as well. VS code version March release insider.

Aha, thank you. It seems to work when I wait for it to stop in the breakpoint before I attach the VS Code debugger but it wonā€™t stop at new breakpoints I add in VS Code, only at debugger statements. Is that the same behaviour you get?

Yes once it stops at debugger statement you can put break points as you wish and it will stop but debugger statement is a must.

1 Like

Well new version of Meteor helper is out for VS code thanks Ramon.

Thanks for the launch.json!
This is soooo much better than node-inspector!

1 Like

Hi,

I have tried to follow your instructions on the Meteor leaderboard example taking into account that:

  • I do use sourcemaps (source is in CoffeeScript) which is reflected in my launch.json file
  • I am trying to attach a node debugger for the server-only sections of the code and then a chrome debugger for the client-only sections of the code

I have put:

  • a debugger statement in the isomorphic code shared by the server and the client;
  • breakpoints in the isomorphic code, server-only and the client-only sections of the leaderboard.coffee file

When I attach the node debugger, all breakpoints turn grey with a tooltip saying:

  • breakpoints ignored because generated code not found (source map problem?)

Here is a screenshot of the problem:

Any idea about what I am doing wrong?

Thanks

Have you set the option "port": 5858, instead of "port": 9222 launch.json#L43?

In the node (server) debugger configuration yes.
In the chrome (client) debugger extension confiugration, no, I left the ā€œportā€: 9222, following the single example of launch.jason file given in the documentation of this extension.
Should I have ā€œportā€: 5858 for both the node debugger and the chrome debugger attach configurations?

Thanks!

Here is my current and probably buggy launch.json file:

{
    "version": "0.2.0",
    "configurations": [
        {
            "name": "Launch",
            "type": "node",
            "request": "launch",
            "program": "${workspaceRoot}/leaderboard.coffee",
           // "program": "${workspaceRoot}/meteor://šŸ’»app/leaderboard.coffee",
            "stopOnEntry": false,
            "args": [],
            "cwd": "${workspaceRoot}",
            "preLaunchTask": null,
            "runtimeExecutable": null,
            "runtimeArgs": [
                "--nolazy"
            ],
            "env": {
                "NODE_ENV": "development"
            },
            "console": "internalConsole",
            "sourceMaps": true,
            "outFiles": [
                "${workspaceRoot}/.meteor/local/build/programs/server/app/app.js",
                "${workspaceRoot}/.meteor/local/build/programs/web.browser/app/app.js"
            ]
        },
        {
            "name": "Attach Server",
            "type": "node",
            "request": "attach",
            "port": 5858,
            "address": "localhost",
            "restart": false,
            "sourceMaps": true,
            "outFiles": ["${workspaceRoot}/.meteor/local/build/programs/server/app/app.js"],
            "localRoot": "${workspaceRoot}",
            "remoteRoot": null
        },
        {
            "name": "Attach Client",
            "type": "chrome",
            "request": "attach",
            "port": 9222,
            "address": "localhost",
            "sourceMaps": true,
            "outFiles": ["${workspaceRoot}/.meteor/local/build/programs/web.browser/app/app.js"],
            "diagnosticLogging": true,
            "webRoot": "${workspaceRoot}",
            "url": "http://localhost:3000/"
        },
        {
            "name": "Attach to Process",
            "type": "node",
            "request": "attach",
            "processId": "${command.PickProcess}",
            "port": 5858,
            "sourceMaps": false,
            "outFiles": []
        }
    ]
}

Visual Studio for macOS was released today, it might be worth checking out for Meteor development.

1 Like

Here my config to launch Meteor. Iā€™m not able to debug on launch, but itā€™s closed. If anyone could helpā€¦

{
      "type": "node",
      "request": "launch",
      "name": "Launch Meteor via NPM",
      "runtimeExecutable": "${workspaceRoot}/.meteor/local/dev_bundle/bin/npm",
      "windows": {
        "runtimeExecutable": "npm.cmd"
      },
      "timeout": 100000,
      "runtimeArgs": [
        "start",
        "debug"
      ],
      "port": 5959,
      "cwd": "${workspaceRoot}"
    }

In package.json

"scripts": {
    "start": "meteor --settings settings.json",
    "debug": "meteor --settings settings.json debug"
  },

Have you resolve this already? Iā€™m also having the same problem.

1 Like

Just entered issue #8590. For Node debugging there is an issue with the way that meteor handles sourcemaps.

Give the bug an upvote so MDG can gauge popularity of the request.

1 Like