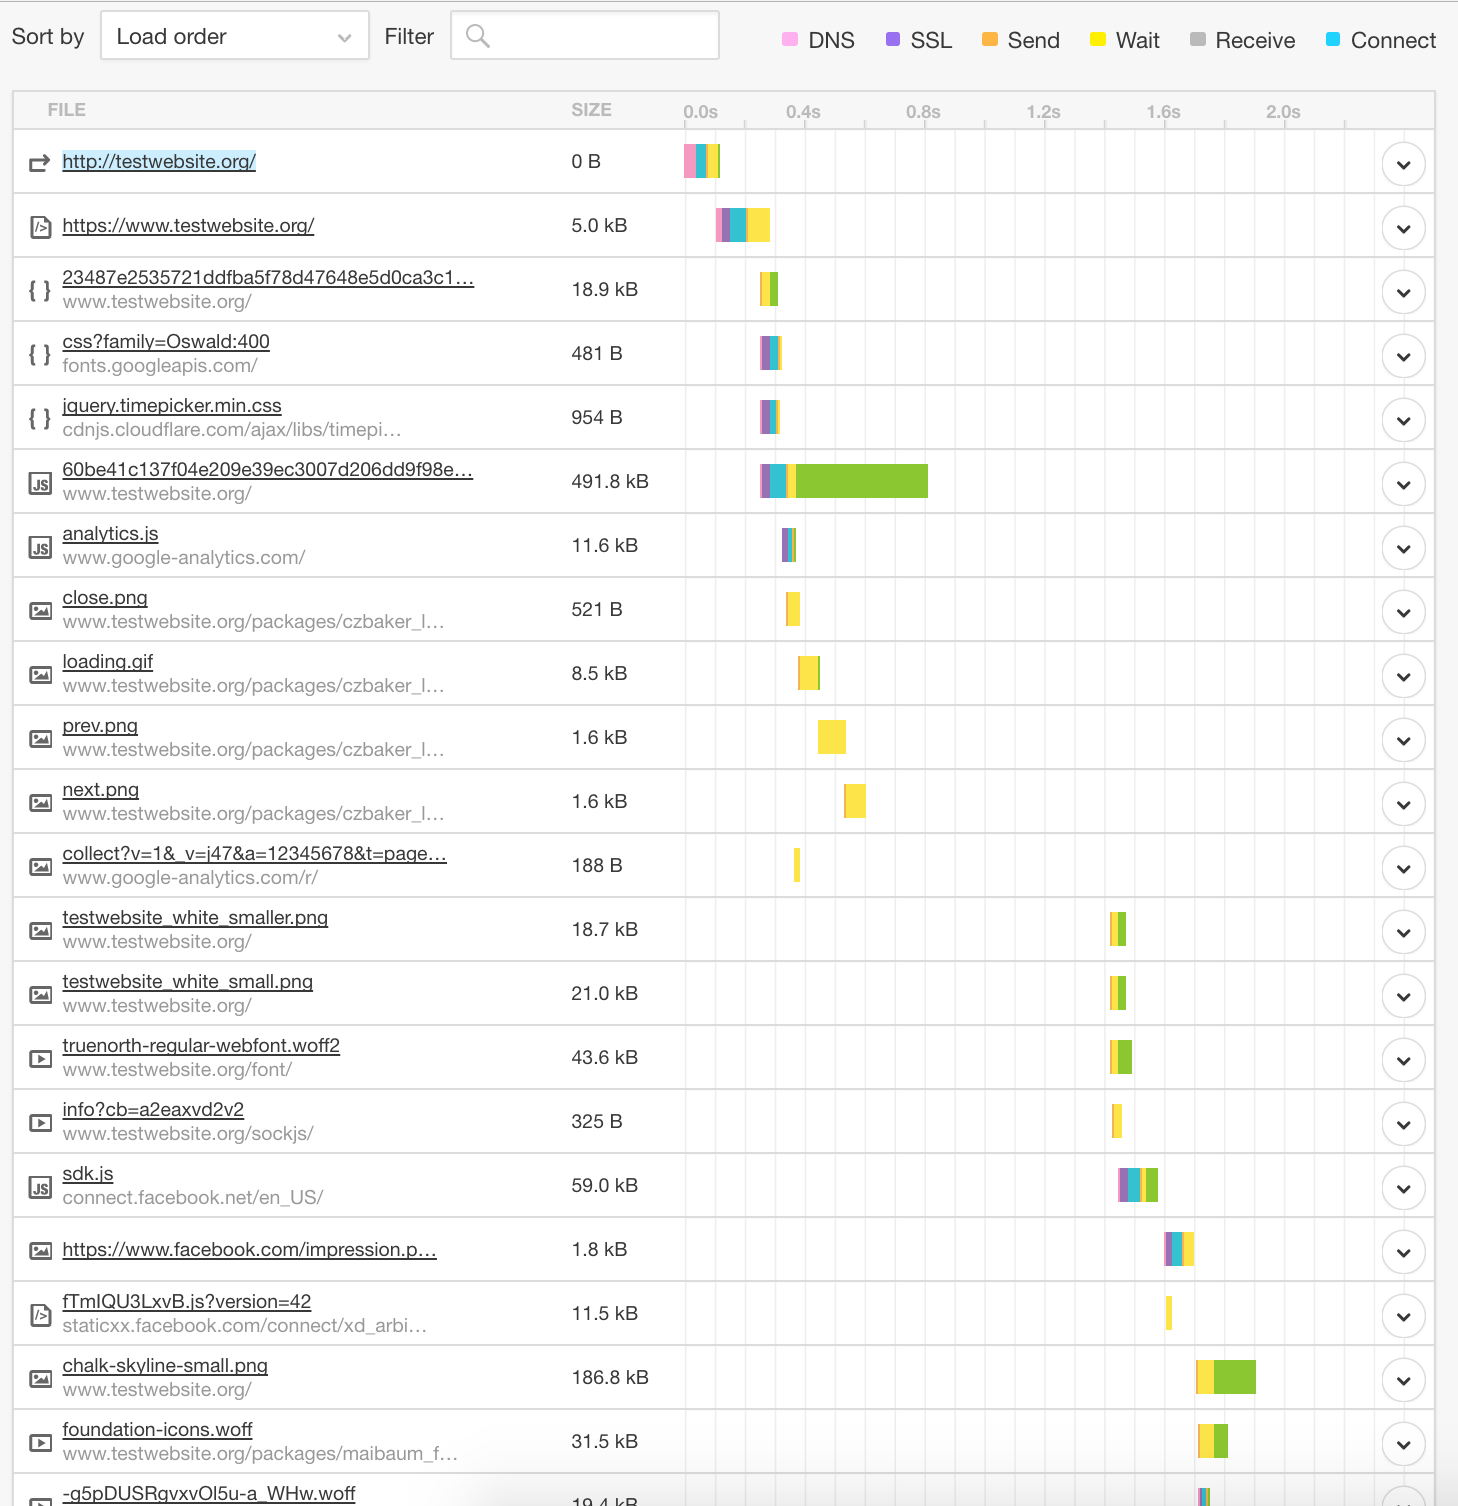
Refer to the image below, which is a Pingdom output of loading my Galaxy-hosted meteor app. Toward the middle, right before the “testwebsite_white_smaller.png” file, there is a long gap where nothing seems to be loading or doing much of anything. Is this the period of time where the client’s browser is processing/compiling the compressed Javascript? On Chrome’s “network” tab, the red vertical “Load” line shows up right near the end of that gap. Further down, the rest of my app’s assets load into the page.
I’m not sure how to go about debugging/shortening that gap in time. Are there other tools I can use to monitor what’s going on there? Thanks!