I have a situation where I start up 1 observer on a mongo collection of 250 items, and then for each doc in that collection, I add/remove/adjust a doc in another collection. The for each document in this collection, I create an an observer (i.e., I create 250 observers) that observes a set of line items from my LineItem collection.
There are 50,000 line items in the line item collection and each one will appear at least once in the query behind one of the 250 observers.
Whenever a line item is added, removed, or updated in such a way that the query results it would appear in change, I have to run some recalculations that take about 5-10 seconds.
When I start the app up, all the observers have to be initialized and all the “live views” have to be computed, so the CPU is very intense for the first 15 minutes after the app starts as it initializes itself.
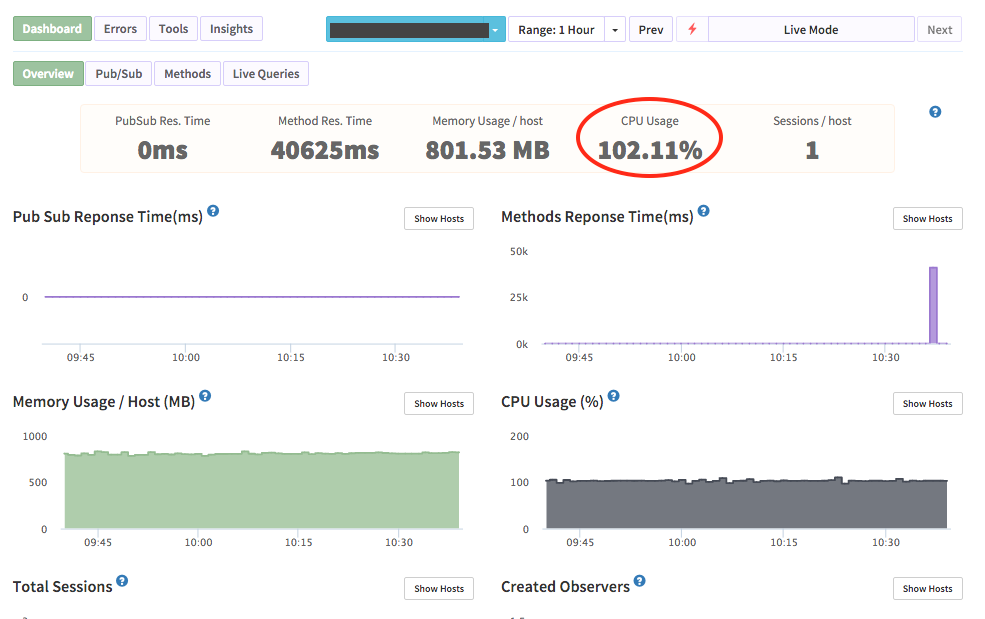
What I don’t understand is why the CPU usage does not calm down when there are no “live view” re-computations occurring. it is almost as if just holding open 250 observers eats up all the CPU by itself.
I’m using Kadira to monitor all this – screenshot attached.
I think this is the gist here. I doubt this is a CPU blocking operation. And that’ll block your CPU and stay 100% for a long time as you add/update stuff.
(Share us a 20 sec CPU profile and I can confirm that)
If this is the case, you may need to rethink on how to deal with this. Do you want to to do it for every one, if so, I suggest to do it outside of Meteor (or use a separate meteor app for that task only)
Thanks very much for chiming in, Arunoda - it is like hearing a word from above.
I set up the observers so that any time any line item is adjusted across all 250+ live views, the recalculation will happen immediately (it is smart enough to batch them if a bunch of line items are adjusted simultaneously). However, the re-calculations that take 5-10 seconds only happen a couple of times per hour.
What appears to eat up my CPU is just the fact that I am holding all the observers open in order to wait and see if I need to re-calculate.