out app uses about 500MB of memory before any users start hitting it, so we can just get running on a “Compact”… but would really like to be able to run on a Galaxy “Tiny” instance, at least for a handful of users for dev/test purposes.
A lot of the articles I found seem related to reducing subscriptions and other per user/transaction memory usage, for example
That said, how do we reduce the INITIAL memory usage?
We are using Blaze, have a ton of templates… so not sure if dynamic imports would help? Any thoughts welcome.
Only subscribe to what you need, limit find’s and where it’s possible use caching, although it’s realistic that your App will take around 400mb to 500mb - my App is in production and is taking 450mb but the real memory user is Mongodb which takes as much memory as it can, the mongo manuals say it will use around half of the available memory. I have approx 12gb free from the 16gb I have on my box and mongo is taking around 6gb so seems correct.
Before I had 20k daily uniques I was running this on a 4gb box and it was handling it kinda ok, just a bit slow to load the results in and I had to wait minutes to run any large scripts on the dataset. So I bumped it to 16gb and it’s good now. I am running everything on one box with nginx as web server and also doing all my data scripts there and it’s mostly idle now although over 300 concurrent connections can cause it to crash the node thread and cause a out of memory error which sucks
I’m not sure if that’s possible (unless you have literally nothing in your App) maybe someone on this forum knows. Would like to know also
The lowest I’ve seen mine go is 350mb and that’s during the night when no one is hitting it up. I am only running essential packages like the accounts and a few npm packages.
I just run Meteor as an upstream and keep my bulk of images outside of Meteor entirely so it’s on it’s own vhost for images, this seems to lighten the load. To be honest there is no bottleneck with nginx and it’s barely ever not idle, it’s mongo that takes up all the resources.
In my vhost I run the following, you must set the port for the one you use for meteor on your local and what you set in the PORT env var.
I don’t need to, this thread is about minimizing memory usage and I am replying that Mongo uses the most, and meteor doesn’t really use much past half a gig, even with a load of several thousand visitors.
BTW, out Mongo is running on Atlas, … the deploy on Galaxy still uses about 500MB ram before users start hitting it.
Is it the mongo connectors (packages, npm ) that get loaded that use the memory?
Is there a way to proffile the app to see what’s using the memory in node?
We have APM on Galaxy, but I don’t see a way of telling what components are using memory in the “pre-user-load” state.
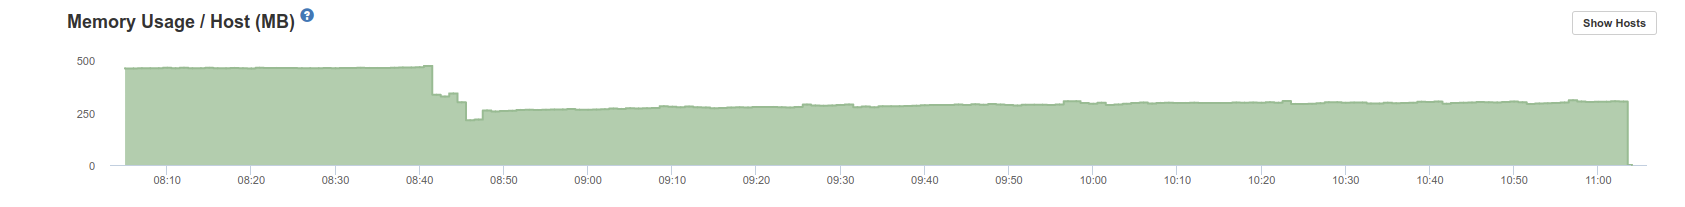
I started watching memory more closely now and it does move around a lot, currently my app is only using 100mb and then it can peak to 300mb and beyond.
Node is limited to 512mb on 32bit and 1gb on 64bit systems. Although you can raise this with --max-old-space-size e.g
node --max-old-space-size=1024 main.js
Will start your app with 1gb of memory available. The value given is in mb.
Currently, by default v8 has a memory limit of 512mb on 32-bit systems, and 1gb on 64-bit systems. The limit can be raised by setting --max_old_space_size to a maximum of ~1gb (32-bit) and ~1.7gb (64-bit), but it is recommended that you split your single process into several workers if you are hitting memory limits.
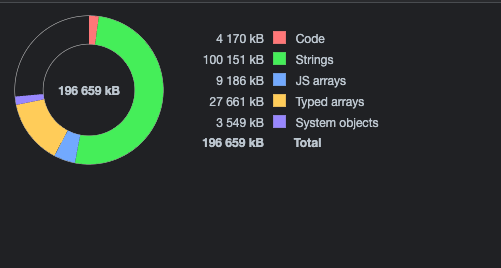
Thanks. I got a response from Meteor Galaxy support too, to use heapdump - npm which I have just installed and loaded the dump into Chrome Memory tools… I am not 100% sure what I am looking at … .but I see this summary that seems to indicate it’s using ~198MB??
The other tabs a are bit scary Will see what help I can get to decipher this stuff
What’s the decision making process here, surely you can just run it on a business machine, and not the virtual equivalent of a usb pen drive? 200mb is nothing. My database is using 7gb.
Just to be clear this is about memory, not disk size
This is for a replicable entry point for our customers running on on their own standalone environment.
This is the entry point, so it’s pretty much single user and they can upgrade. We’re going to use MongoDB Atlas for the data, so that’s not an issue. So the goal was to see if we could run it on a Meteor Galaxy Tiny instance - Tiny: 256MB RAM, 0.3 ECU. Essential: $9 / month
I had a look at the memdump details (above) and I think it’s basically all the templates & methods that are chewing up memory.
BTW, I have another microservice Meteor based server we use for another system and it can run with 79MB Ram
So the question is if there are any general strategies that could reduce the initial non-logged in Memory footprint - I have not tested but perhaps Dynamic Imports could help, until we need that code running.
I am talking memory not disk space. I use 16gb memory with 8 cores
$9 a month for a production server isn’t realistic bud. You need to be more realistic. It’s not going to work. Your machine has a third of one core, so in terms of power your tv probably has more…
It’s really a dev machine for the customer - so not full production. Think of it as a “toe in the water”… which they can easily scale up to a production system, if/when needed.
We have customers today that run fine on the 1GB CPUs in a K8s (Galaxy, AWS other).
AWS and other cloud platforms have 1GB machines that are cost about $10/mo. … so that’s an option for us and is our current plan of attack… .but I wanted to see if we could run it on Galaxy… would be nice to have all offerings under one roof.