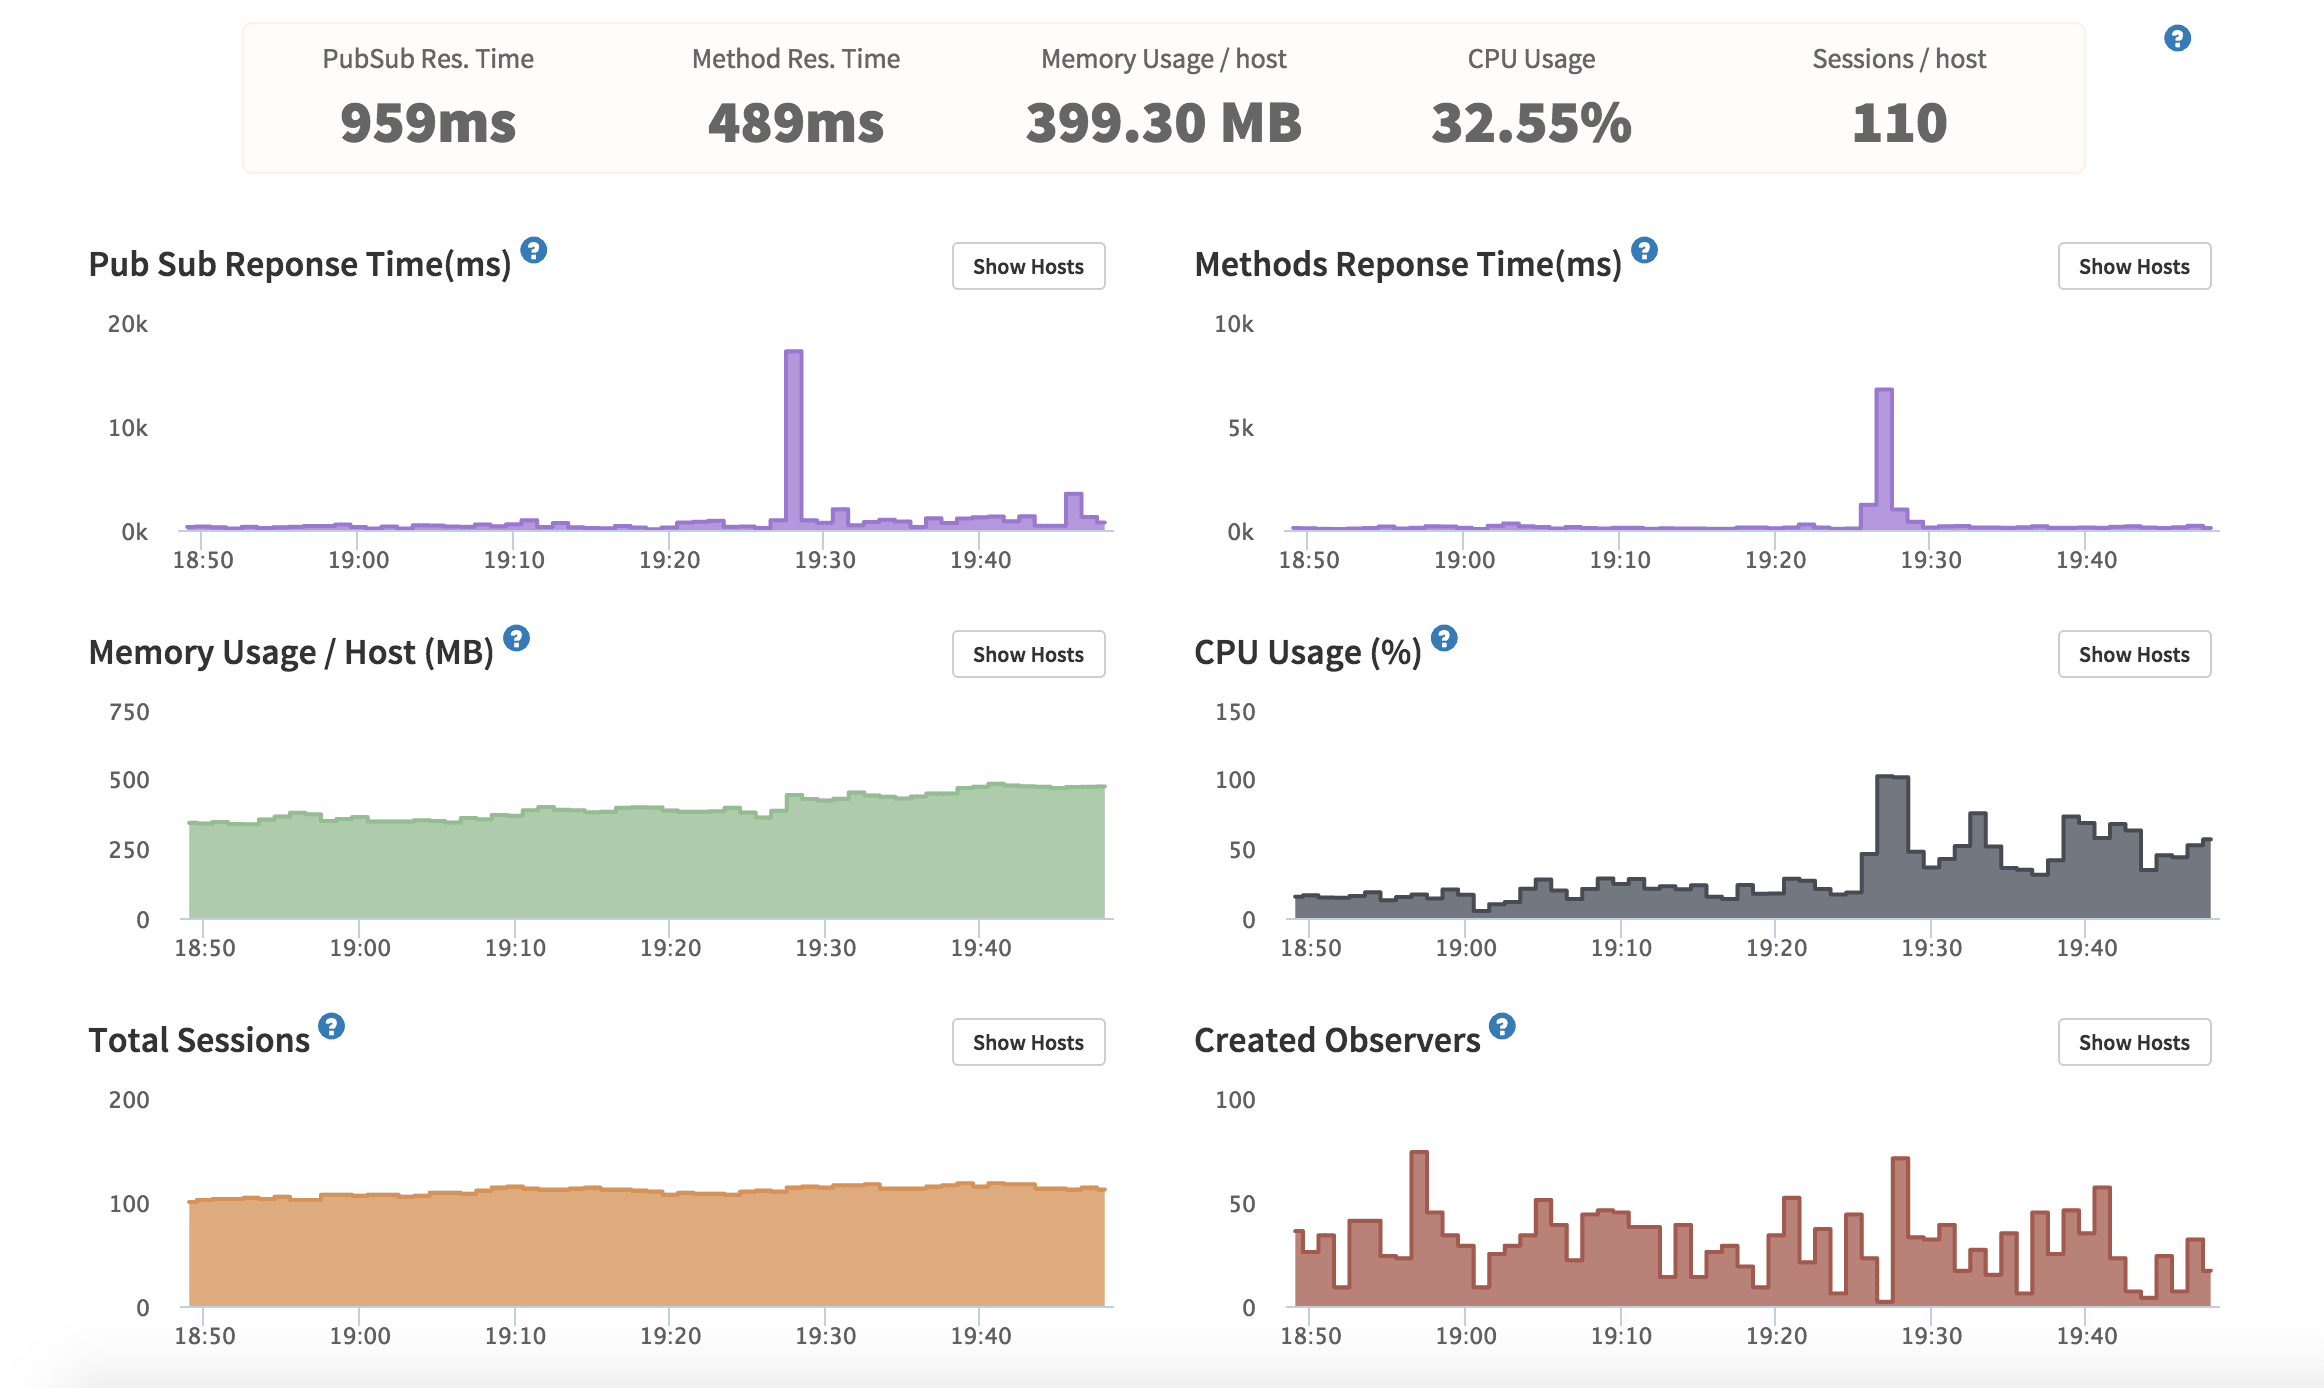
Most of the time, my app is running at 10-20% CPU and under and using about 400 MB RAM (out of 1GB).
Tonight RAM started hitting 600MB, but CPU flew up to 70% and then eventually 100% crashing the app. I was handling more traffic than usual but it wasn’t that much more. Why did the CPU increase so quickly out of nowhere instead of increasing gradually as does the RAM?
Responses very much appreciated. Have a serious scaling problem on my hands now.
What seems to have a very big impact is the number of observers increasing a lot. Would restarting my app fix that problem? After the restart, the number of observers dropped from 500-1000 to under 50 or so, although fewer users online.
What could cause exponential observer count? I don’t think I had an exponential number of users on my site. At least not according to analytics and kadira.
Restarting is a temporary fix. It sounds like something is failing to stop cursor observers. You’ll need to hunt this down and correct it to actually fix the issue.
I had a similar issue with the app being non responsive when switching between routes. Then i removed all Meteor.subscription from the router and replaced them into the template this.subscriptions. The unresponsiveness went away and the app is super fast now.
I highly suggest using flow-router to render the templates and handle subscriptions and data all in the template, keeping everything in one place.
I am guessing that you COULD have some subscriptions somewhere that is not being terminated after the user switched routes. And as they go back and forth between pages they are just keep subscribing to more publications and not ending the previous one.
This could happen when you use Meteor.subscribe, because it subscribe the whole application to a publication, not just the template instance.
What i am suggesting is that dont use Meteor.subscribe unless necessary. Keep subscriptions local to the template so when people switch between routes they are 100% un-subed from the previous page publications .
Need to load up more instances of the app, but need to refactor code first since there are a bunch of tasks running on timeouts that shouldn’t be called twice
Well I upgraded to DO $20 last night. So it now has 2GB RAM, but exactly the same issues. Only using 500MB of the 2GB, so could that really be the problem?
MongoDB is hosted on Compose.io Elastic Deployment. I could send them an email to use more RAM there. No idea if that’s needed though.
And plan on moving on using multiple machines, but need to refactor code first to do it.
mongodb is on the same server. You stated otherwise, Maybe this is a misconfiguration? Separating mongo and meteor helps a lot.
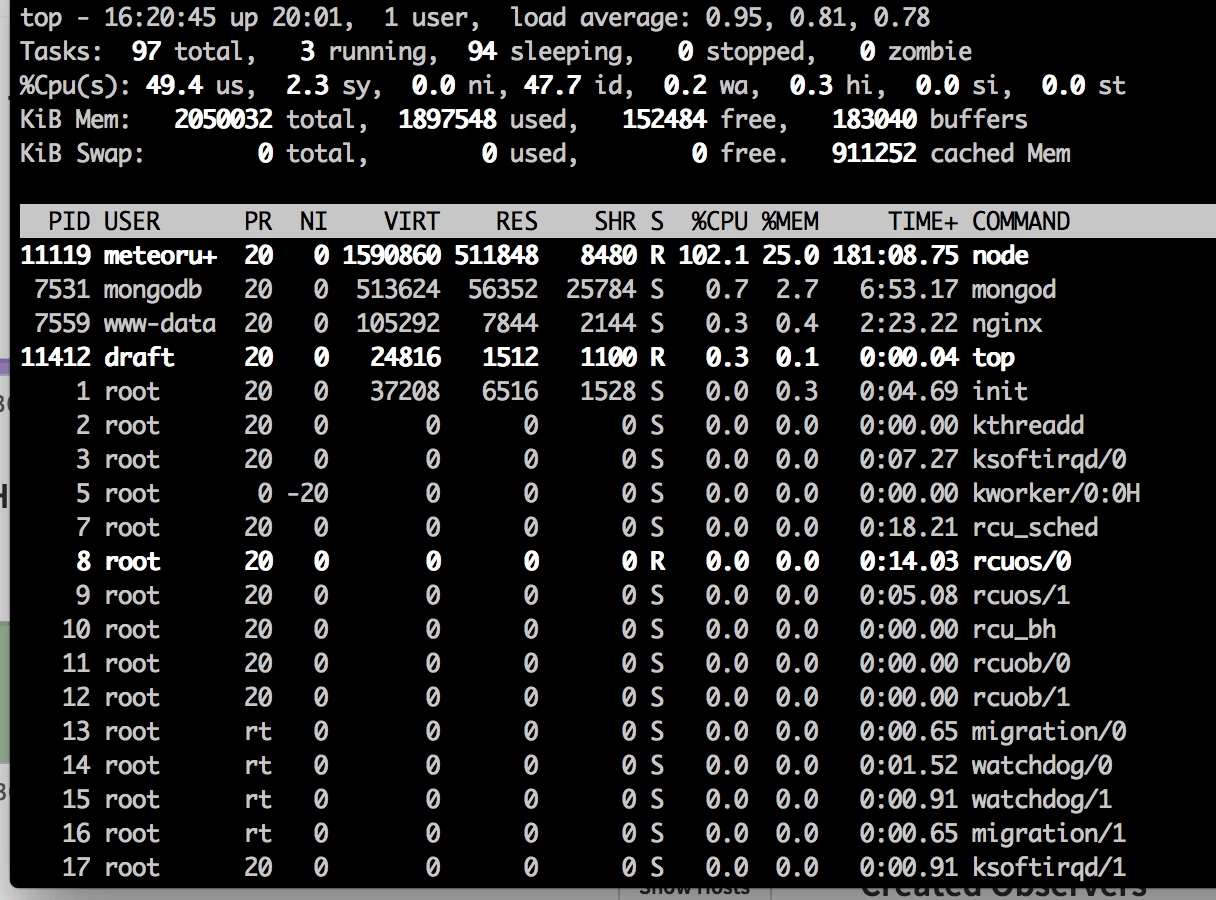
Is the server unresponsive during this top? It looks like it has high load on single thread. Maybe there is some expensive logic running? Maybe the cpu is too weak? (happens often with VPS). I see a lot of sleeping tasks, maybe node is forking a lot? I have 277 taks on a 64 gb dedi with 30 vps, it seems strange to have 97 tasks on a single VPS. But this might be a wild guess.
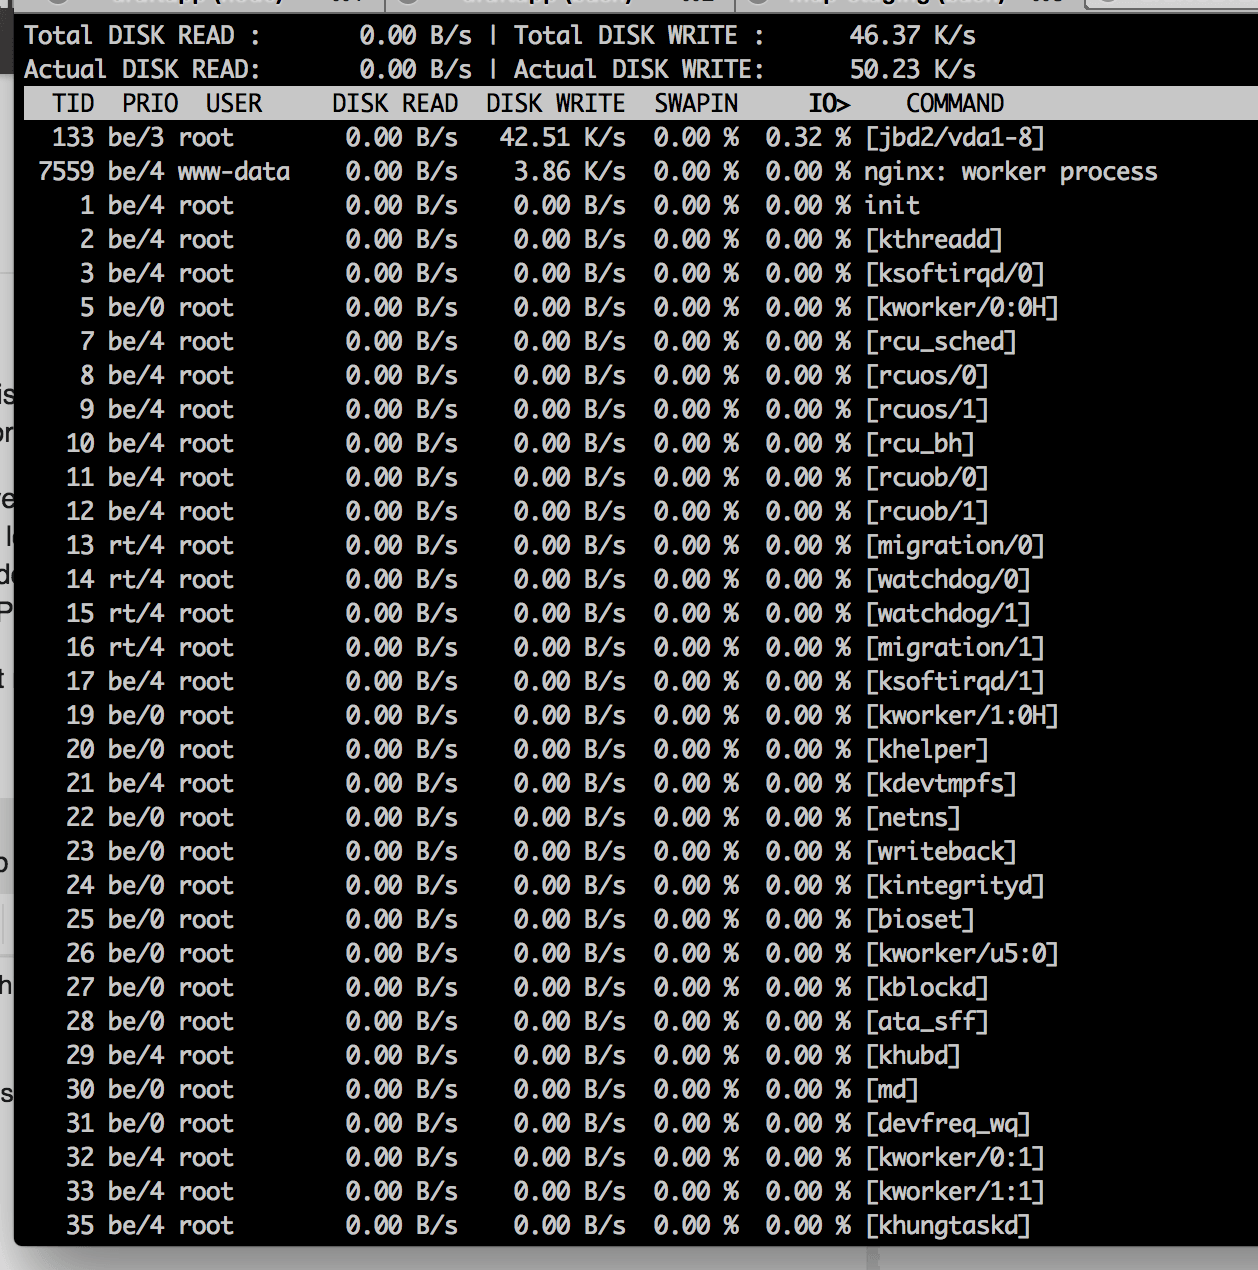
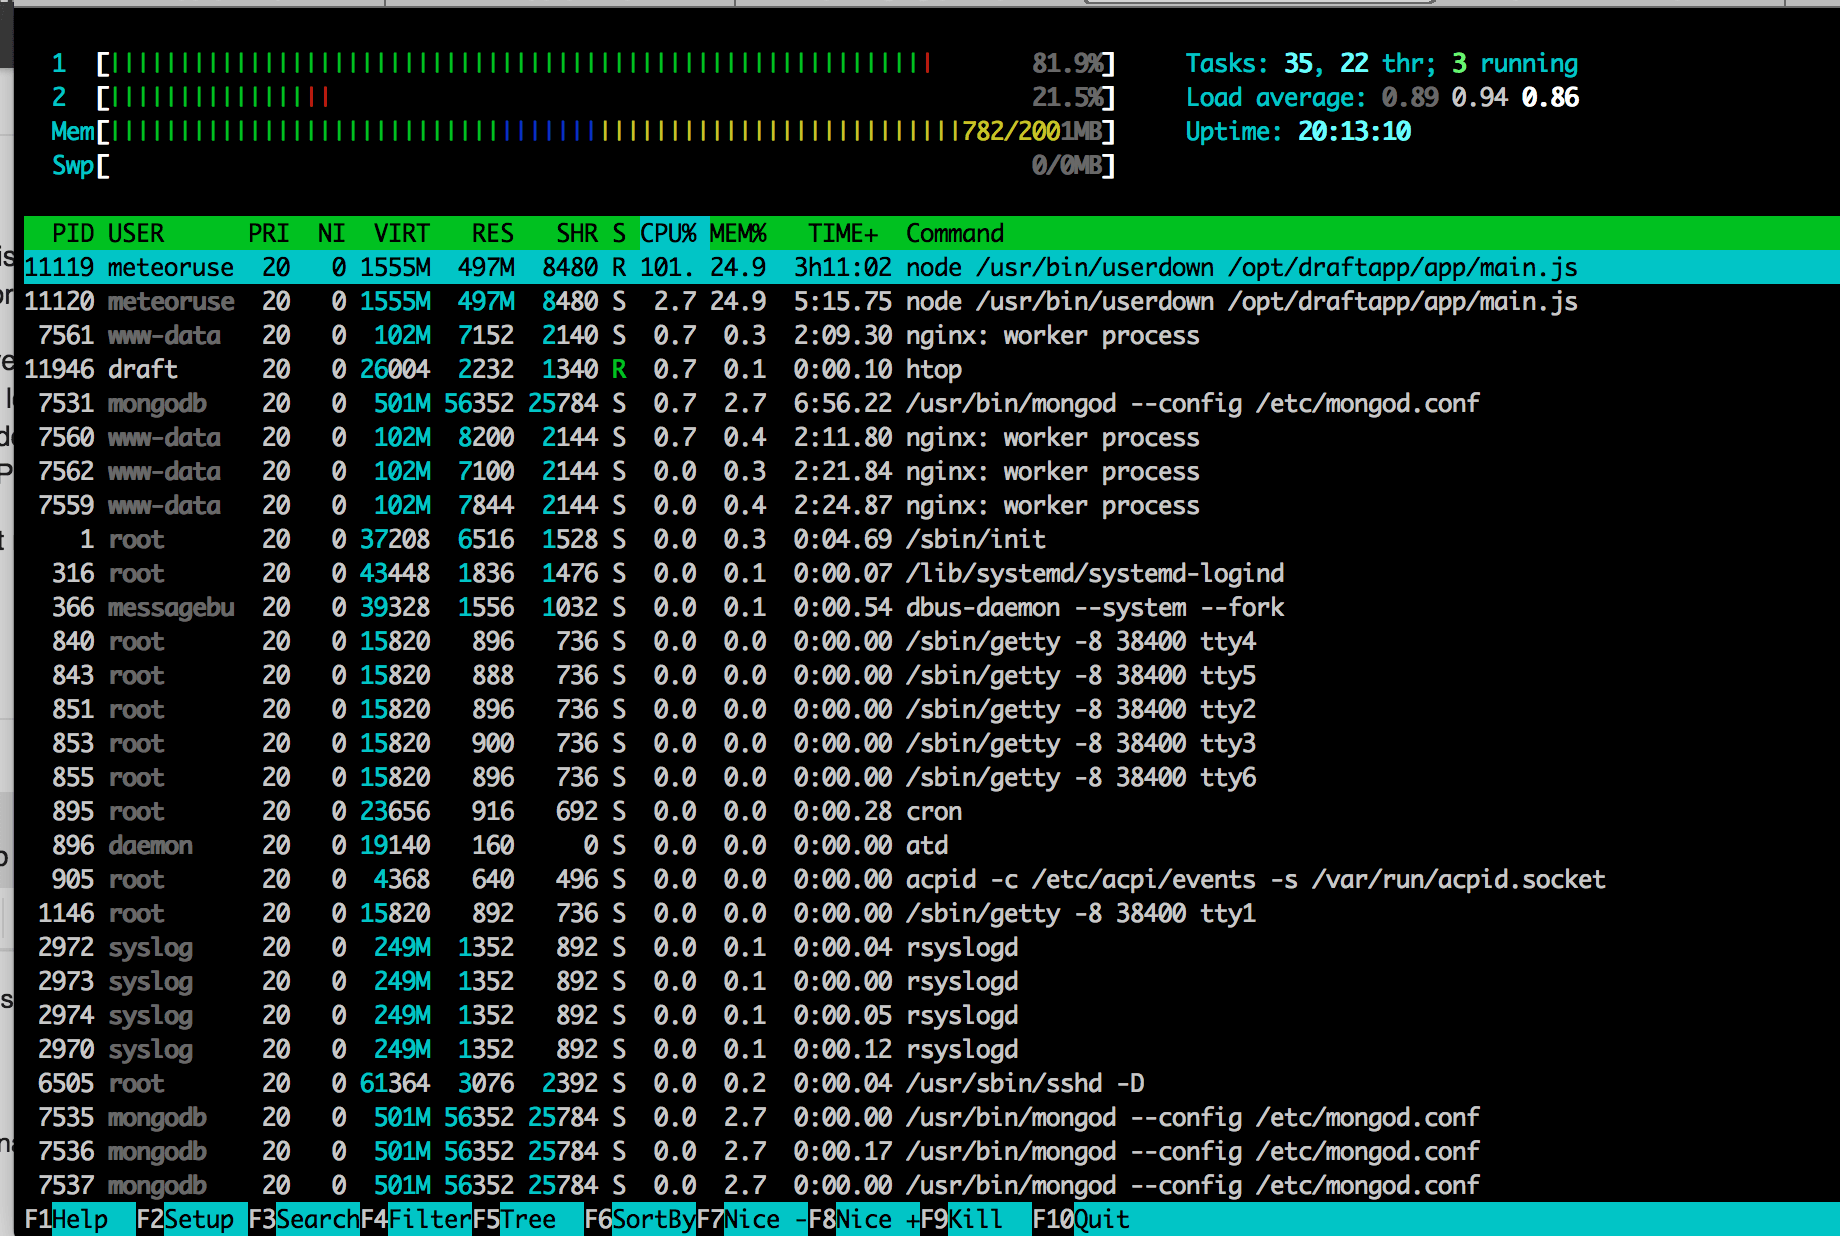
Try to post me also iotop and htop (more powerful than top)