Hello,
I am getting the following notification for a meteor app:
Your Linode, GQMS_Staging, has exceeded the notification threshold (90) for CPU Usage by averaging 128.2% for the last 2 hours
Any ideas on how to fix?
Please help.
Hello,
I am getting the following notification for a meteor app:
Your Linode, GQMS_Staging, has exceeded the notification threshold (90) for CPU Usage by averaging 128.2% for the last 2 hours
Any ideas on how to fix?
Please help.
One thing to check is that your Oplog is working. If it’s not, Meteor will start spamming your database constantly. Happened to me  Easy to spot if you have Kadira - the number of fetched documents will go up into the millions.
Thanks a lot for your answer, I am new to meteor.
Is Kadira still available? Every web article about meteor mentions Kadira but one article says the service is not available anymore.
Any other way to check Oplog is working?
Check which version of Node you might have installed on the server. If it’s above 4.x then it can cause massive CPU usage.
Are you sure?
I am using node 5.8.0
That’s true. You need to use the version of node which your version of Meteor is using. You can check that by doing meteor node -v in your dev console.
The only exception to that is that node 4.8.1 exhibits memory leak problems and should be replaced with 4.8.2 (the current version of node for Meteor 1.4.4.2).
My Sys Admin tried updating to 6.10.3. yesterday and it caused the CPU usage to hit 100%. When we downgraded to 4.8.3 everything returned to normal.
It might be that 5.x works (in that Meteor runs) but 6.x definitely causes issues at the moment and I think you need to run 4.8.2 or 4.8.3.
INTERESTING! I’ve been trying to figure that out myself!
I have CPU spikes to 100%, then it’s fine! I will try this!!!
Please let us know what works for you.
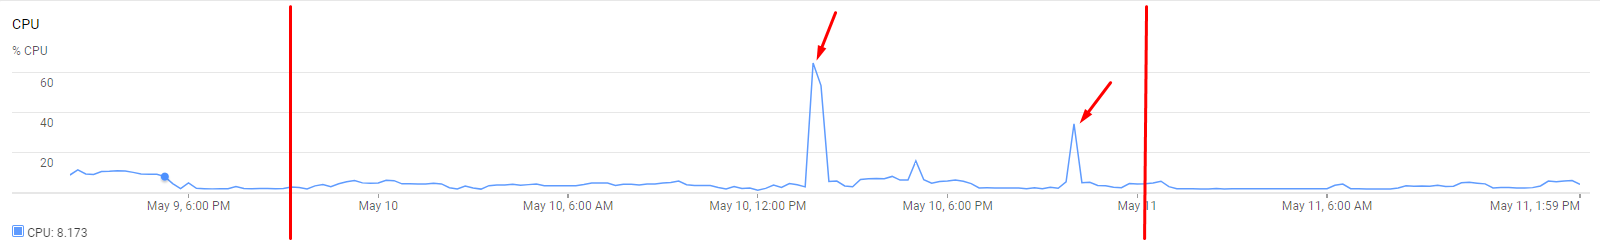
As you can see I have two massive spikes on my MongoDB server.
The same spikes on my NodeJS server. Together.
It may look small, but they lasted 15 minutes each. I couldnt identify why, then it just went away.
I even added 8 cores to the CPU and it STILL maxed out at 100%. Cost me an arm…
I’ll play with Node versions and report back. This usually happens ~10 minutes after starting my application, lasts for ~10 minutes, then runs normal.
Is Oplog required for meteor apps Even if there is No replication?
I noticed spikes of that nature (and even crashes) when working with collections that don’t have indices on the fields I query. Worth checking.
So do you mean, _id:09as8dlaksjd978, _id:asdmjasldjasd, _id:as09s9s9s9s99s
ALL my data has that. Is that ‘indexed’ as you say?
he means indexes for mongodb collections.
you must add indexs for fields that are used in search queries.
_id field is always indexed.
_id is automatically indexed. If you use other query parameters, like for example finding all documents in a collection by userId, you better make sure there is an index on the collection. Unfortunately detrimental behavior will only emerge as the collection grows, which usually never happens on a dev environment.
I had this case where my production app would crash and the same query would work fine on dev. The reason was that live data on prod was like 50x more, and mongo/meteor had to read in the entire collection which crashed the server. Adding an index to the field used in the query immediately solved the problem.
So an example of this would be:
var bad = Posts.Find({ some_data:"example", {fields:{a:1,b:1,c:1}});
var good = Posts.Find({ some_data:"example", {fields:{_id:1, a:1,b:1,c:1}});
There needs to be an index on some_data. Which fields you return is irrelevant. Also, the _id field is always present and does not need to be specified with the fields option.
I still don’t understand what that means
How do I set an index? [quote=“herteby, post:17, topic:36448, full:true”]
No, these are indexes:
https://docs.mongodb.com/manual/indexes/
[/quote]
Ohhhhhh. So it’s very much like a cache of data.
So let’s say I have 1,000,000 records for some_data in this case. Now I’m going to add an index.
Will this cause MongoDB to do a bunch of processing to index that collection by that field? Thus building an index? Now when I go to run that search again, it’ll be super fast?
Here’s my query, I have to run this every 10 seconds for the client. It for some reason won’t automatically update reactivity. I am currently running a 10 second interval and resubscribing to the data!
I know this is hurting my CPU, how would this be optimized?
var player_ship = Posts.findOne({type:"ships", owner_id:this.userId, fleet_status:"selected" });
if(player_ship){

	var range = 100;
	var scanner_left = player_ship.x - range;
	var scanner_right = player_ship.x + range;
	var scanner_up = player_ship.y - range;
	var scanner_down = player_ship.y + range;

	return Posts.find({
		$or:[
			{type:"ships"},
			{type:"planets"},
			{type:"asteroids"}
			],
		x:{
			$lte:scanner_right,
			$gte:scanner_left
		},
		y:{
			$lte:scanner_down,
			$gte:scanner_up
		},
		last_activity:{
			$gte:time_timeout
		}
	},{fields: {
		_id:1,
		type:1,
		title:1,
		createdAt:1,
		timeAgo:1,
		owner_username:1,
		image:1,
		x:1,
		y:1,
		damage:1,
		speed:1,
		status:1,
		timeAgo:1,
		shield:1,
		shield_max:1,
		hull:1,
		hull_max:1,
		mining:1,
		speed:1,
		cargo:1,
		cargo_max:1,
		target:1,
		action:1,
		fleet_status:1,
		direction_rad:1,
		zindex:1,
		}

	});
}
So I would want to index:
type
x
y
last_activity
And this would dramatically increase performance?