I’d consider myself quite experienced with Meteor (been working with it full-time for 6 years now), but I just can’t figure out why my Galaxy containers regularly come back saying “Container unhealthy”. Cranking up to quad or even octa containers (6-10 instances) often won’t solve the problem. I usually have to do a fresh deploy for it to go away.
I’m hoping someone can give me pointers for where to look for clues. I know it’s rather open-ended and there are many ins-and-outs to someone’s codebase, so this is more of a broad “where should I go in my journey to debug the problem?”
Here’s what I’ve been looking at closely over the last 6 months:
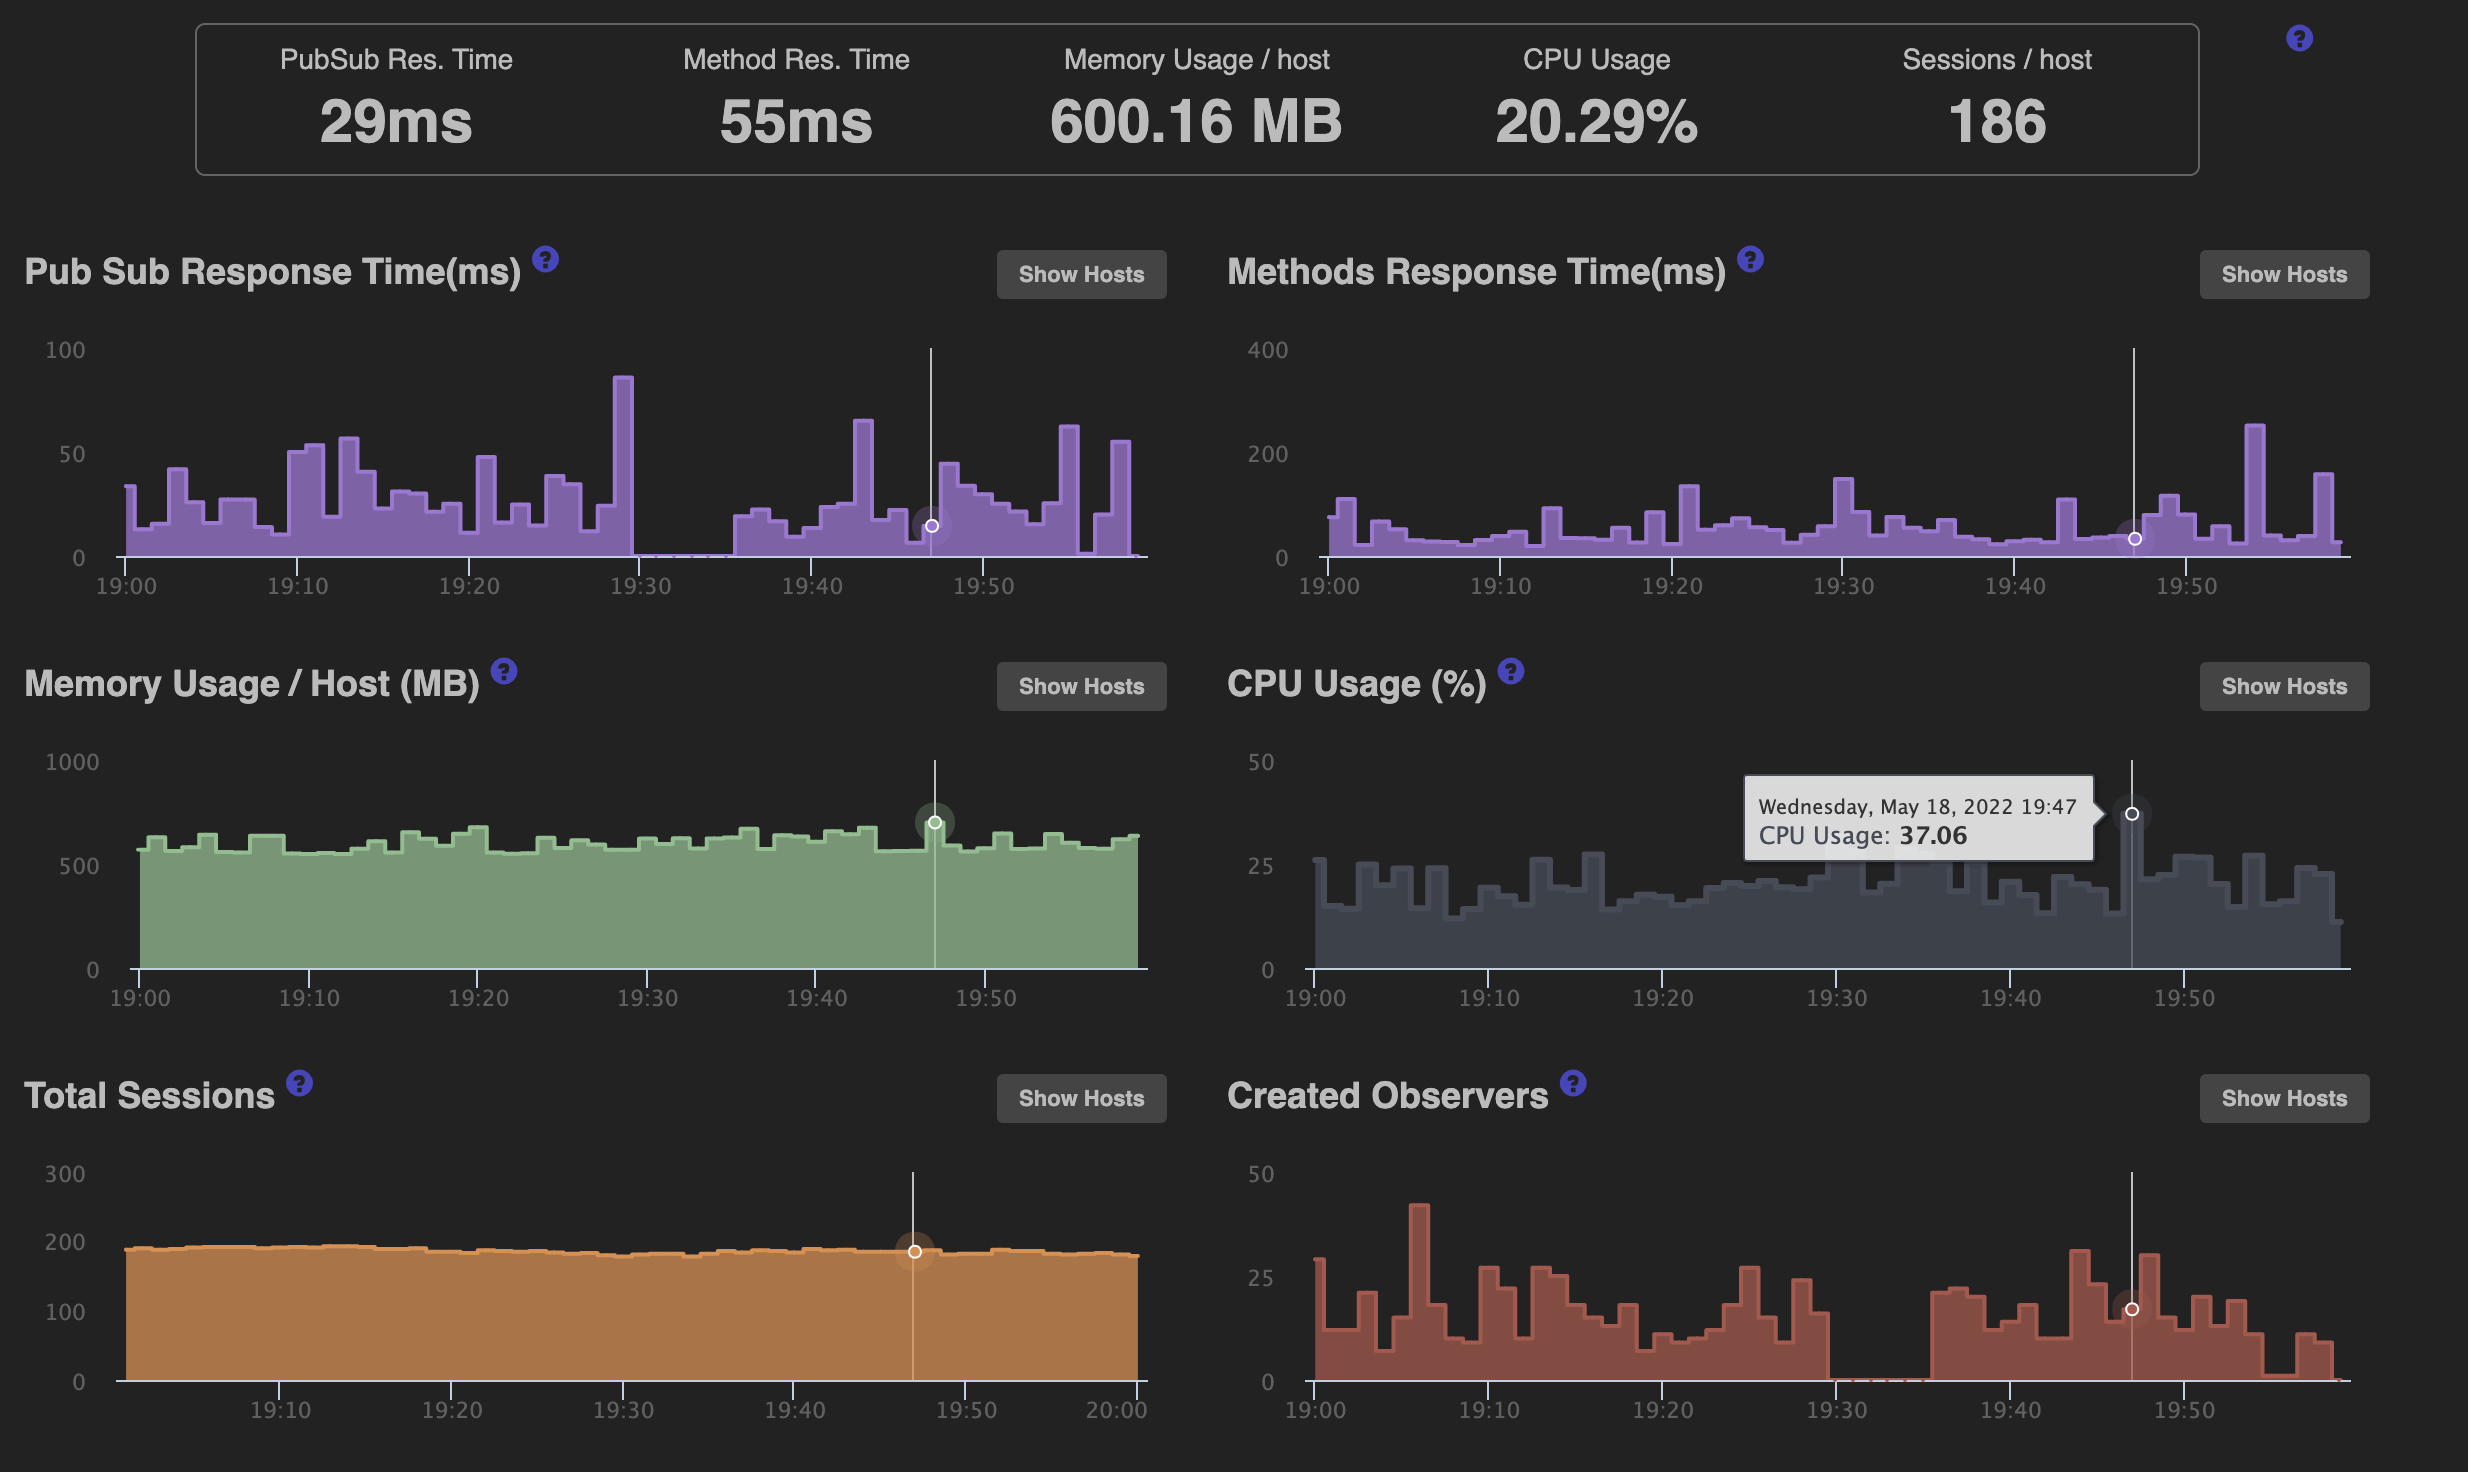
APM
I subscribe to Galaxy’s APM to monitor everything. Below is a screenshot of a container that was supposedly “unhealthy” - you’ll see the CPU was at 37% when the Galaxy report came through.
Subscriptions
I’ve been working hard to remove as many subscriptions as I can and replace them with Methods. I know they’re resource hogs, so I’ve tried to minimize that. I still have a couple though and I’m continuing to explore ways to eliminate them, hoping that they’re path to salvation.
Heavy tasks
I’ve been offloading heavy background tasks to separate cron servers hosted outside Galaxy for years now in an attempt to keep production happy.
Oplog
I can see there’s a lot of oplog tailing going on in my app, so I tried Redis Oplog but boy oh boy did that mess a bunch of stuff up. Ended up getting a lot of users complaining about lost reactivity (eg. in chatrooms after going idle for an hour), so went ahead and removed it.
CPU Profiling
I’ve been using this package to take CPU profiles of unhealthy containers: quave:profile - Packosphere
I can’t really identify anything crazy in there, either. I’ve linked one here for reference. Unfortunately I can’t really make heads or tails of it.
No, but I very much have the same problem/question
Containers that seem very healthy to me get this warning. I use to stress out, and kill the container. I stopped doing that, to see what would happen with the container/application.
Basically, we do a check on your container, and if it doesn’t respond in 5 seconds, the container is considered unhealthy.
It can be various things, like heavy processing at the time, high memory usage, or something blocking the main thread of the node.js.
It could be a package-related problem. One of our clients was having an issue with a package that was spiking the CPU to 100% every time it was deploying the app
Yep, I’ve exhausted all that @harry97. Just trying to find clues for what causes the spike but alas no luck. Nothing in APM to give any indications when it happens
I did recently add my own version of smart-disconnect that seems to have eased the load. Haven’t had a warning in 24 hours (fingers crossed).
oh yeah, i also burned myself heavily with redis oplog. It just makes stuff more complicated.
The problem i had was bulk-operation. We have a worker pod (not galaxy) that uses a job queue to do some background calculations (mostly updating stats and giving achievements to users.)
So we had a lot of looping over users and similar and updating collections regularly. If you are using normal meteor collections to do these updates, you might run into a problem. If you are using redis-oplog, all these updates will be sent to redis and from there inform all containers, which uses a lot of cpu on all containers.
I then switched to use mongodb bulk operations, but this will bypass redis-oplog complety and clients won’t get an update at all.
without redis-oplog its less severe, as bulk operations are still picked up by oplog-tailing.
However, if you have some subscription on a collection which changes very regularly, its better to use disableOplog: true on that, which falls back to polling on that collection (you can control the polling interval).
Maybe check whether you have a subscription to a collection that changes often. Or check whether you have other observers, like observeChanges.
On a side note:
I agree that switching to non-reactive dataloading is often simpler and creates less hard-to-debug performance problems, but i don’t agree that switching to meteor-methods (for dataloading) is always the way to go. I would strongly advice to switch to graphql for new projects, as this solves so many more problems both on the client and server like caching, type-generation, type-safety, catches errors early and tooling is much better.
Monti APM has a couple tools that are useful for this:
The system dashboard shows how much time was spent on garbage collection, and how long the event loop was blocked, among other metrics
Continuous profiling, which constantly profiles the app so you can see what was running or blocking the event loop around the time you receive the notification
This is actually an area I’ve honed in over the last few days. I have a few collections that do update very regularly in the background. So, I’ve tweaked them a bit to reduce the frequency of those updates. I think I’m gonna experiment with disableOplog:true on a few of those subscriptions and see what that does.
For example, for loops that use no asynchronous code. We had a lot of these when putting together data for hundreds/thousands of lines in a CSV import/export.
Adding some Meteor._sleepForMs(lastProcessingTime) at the top of the loop where lastProcessingTime is the length of the last loop added enough time for other processes to run, like the Galaxy health check, in the event loop.