Hi,
A bit similar to this post : Horrible degradation of performance using Galaxy and MongoDB Atlas
We do 5 subscribes when the user opens the app. Around 90kb of data so the rest of the experience is fast.
We’ve been monitoring the duration of those (for one user account only) using Puppeteer on another AWS server and it’s been stable at 1200ms for months.
However, since July 28th, and in a 4 day period, the average has increased to 1800-1900ms. Which is 50% more. It’s now been stable at that level for a couple of days.
What is strange:
-Using MontiAPM, we do not see a degradation. Neither for subs or methods.
-Our node servers are way oversized. Doubling their size or their number changes nothing to the stats.
-The Atlas Charts seem to show there is no slow query.
Strangely, in the Atlas Activity feed of our cluster, we see that on the 28th they changed the IP address of our mongo servers and changed the version number of something (does not seem to be MongoDB however).
We’ve tried to make the Atlas cluster more powerful (double CPU and RAM) and it’s not even noticeable.
We have opened a case with them and they are going to compare the speed of those 5 queries before and after the change.
But I’m suspecting the problem won’t lie there.
We’re worried that the overall system is slower and that it could degrade even more.
We have no idea if it’s user impacting or not.
The only idea we have now is to upgrade from Mongo 4.2 to 4.4 …
What would you guys do to further investigate this issue?
Might be the same as the other issue. Just to check have you updated any packages/Meteor in that time period the degradation occurred?
Upgrading MongoDB is desirable either way.
Hi Storyteller,
We have not done any update since July 15th. No new code or anything else. Our technical team was on vacation and we preferred not to touch anything.
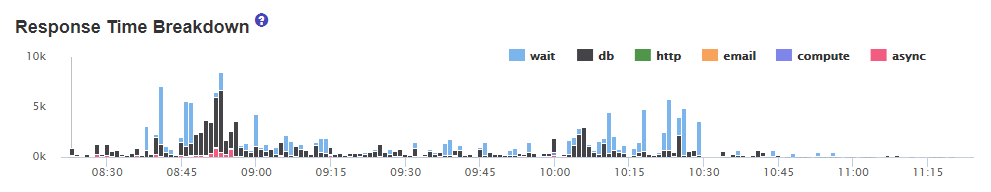
We see on the chart the time it takes for 5 subscribes has increased slowly starting around July 24-26th.
It was always around 1235 ms before and it grew to more than 1800 ms without any apparent reason.
Filipe,
thanks a lot. Reading it was kind of scary. We have not noticed such behaviours. Only subscribe performance degradation but we do seem to receive all updates and callbacks seem to be fine (our app would be unusable without those).
Does it seem to affect only Meteor 2.3.4. ? We’re still on 2.2.1 and Mongo is 4.2 .
We’re worried to upgrade to 2.3.4 and Mongo to 4.4 to make sure we do not get those problems too on top of our current ones 
We’ll wait for solutions to all those problems before that.
Regards,
burni
Meteor 2.2.3 is out which has the latest Node 12, so you might want to give that one a try, but I doubt it is going to affect this issue.
Hi, I don’t know why it was scary to you but that issue is not new and it is not related to latest releases of Meteor at all.
It is just the way oplog works. What part did scary you?
Also, I don’t know why we have two topics talking about the same thing I believe.
We should centralize the discussion in a single place.
See also this answer from Renan Horrible degradation of performance using Galaxy and MongoDB Atlas - #21 by renanccastro
Renan and I used to work together for a big company using Meteor and we also had issues with Atlas sometimes without explanations but they were not related to our code, the problem in our case was in Atlas performance varying a lot.
1 Like
(Apologies, posted this question on the wrong thread!)
Hi Felipe,
Oh sorry. I misunderstood the post about the oplog issue. Ok it’s not happening to us so far.
And as for creating new subscriptions,I thought the other post was about receiving updates late. It’s not the same case we’re getting.
It’s our initial subscriptions that take longer. 1950ms instead of 1236ms.
After re-reading the other post, I’m still not sure it’s close or not. It’s probably because we’re very confused on our metrics because Atlas says everything is fine but that’s not what we see doing that subscribe…
As you say, I’ll probably just interact in the other one 
And a big thanks for your help!
Regards,
Burni
(Note- I just noticed my question regarding Redis Oplog above was on your post and not my own, I meant to post on mine. Apologies!)
What you describe is basically 50% of what we’re seeing in the post you link in the OP.
Our app functions primarily in 2 ways:
-
From 8AM-5PM it’s used in-house for our business, and often times lately there’s only 5 users or less for the majority of the day. We use pub-sub with Redis-Oplog to help optimize this part of our app.
-
We have many routines that run alongside marketplace API’s/etc, and many of these run overnight/outside of business hours.
Lately during work hours, we’ve been having issues similar to what you describe. We don’t see a degradation in performance and nothing on Atlas, but the latency has increased during work significantly.
But we’re also seeing problems outside of our work hours. Our routines that run after midnight are also performing extremely slow, and there’s like a 50% chance that morning comes and our “Fail Safe” has kicked in overnight to throw our server in emergency mode due to too many attempts failing.
So in our case, our Atlas cluster has basically experienced a degradation of performance all around. It can no longer handle pub/sub with just ~5 users at a time. And it can no longer handle the routines that it runs overnight, which it has been doing for years now.
We’ve been trying to work with Atlas support to figure it out. Just today we attempted connecting WITHOUT the “+srv” connection string to try to remove one extra step of DNS. So far, performance has been decent, but the problem comes and goes so I can’t say if it truly helped yet. But it’s something you may want to look in as it can’t hurt to test!
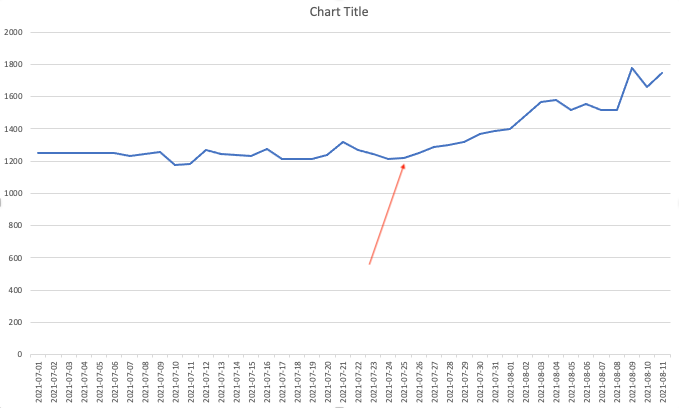
I just want to follow up based upon my earlier message. Using the connection string without the “+srv” has still continued to have promising results!
The graph below shows the improvement, the deployment finished between 10:40-10:45. Since then, everything has seemingly returned to normal.
Please let me know if this works out for you too, as it would be great if this is the common denominator we’ve been looking for to solve this problem!
2 Likes
Hi @Spyridon. May I please ask you about your data infrastructure: is your Atlas DB and your Node servers in the same VPC?
Hi Spyridon,
I’m happy for you. I’ve told Atlas’s support we should try that. Could you share that URL with us so we can “build” ours based on yours (don’t worry about changing the letters and numbers).
Last week they told us that since our problem is not intermittent like yours that the srv thing should not have an impact. I asked again this morning that they help us build the URL without the srv.
We’re thinking our next step could be to migrate to a new cluster. Build a new one and just migrate there.
Ours numbers have been slowing getting worse. We do calculate the average time it takes, on the client side, for 4 subscribes. Their average was 1200ms 2 weeks ago and now they are 2000ms.
We’re very worried it’s going to increase to 2500-3500 without apparent reasons.
Regards,
Chandi
Hi Guys,
Seriously, we’re not even sure we have a problem. I would love someone to “validate” our test/monitoring methodology.
Here’s what we’ve been doing:
When the app starts the first subscribe, it notes down the current time and when the initial 5 subscribes are done, it compares the current time and displays the difference to the console. (Ex: caching took 1200 ms).
We’ve always had that, but recently, using Puppeteer (headless chrome), we open the app of a client account and wait for that console log to show up and we send it to a monitoring system.
That’s the value that has increased from 1200 ms to almost 2100 ms now in 3 weeks.
When I load the same user account on my laptop, I get around 860ms average.
Maybe it’s something else ?
What is strange is I’ve ran the 5 subscribes queries in mongo shell with .explain(“executionStats”).executionStats.executionTimeMillis
And they all return 0ms which means (correct me if I’m wrong):
- the indexes are good
- the db is not slow
- the network between node and mongo could be slower/have more jitter
So it could be:
- node is becoming slower everyday ?
- Puppeteer is getting slower everyday (we’re doing it on 2 different servers, on on AWS and one at my place and they both show the same info)
We’re scared that it has/going to have user impact soon because the number is growing linearly BUT…is it real or it’s just our testing methodology that’s biased ?
What bothers me is that using my MacBook Pro + Chrome gives a number that’s always lower than 900ms and does not seem to increase at all while Puppeteer is increasing.
In your methodology, have you removed all external factors that might affect the execution e.g. network, client speed, browser extensions, etc.?
rjdavid,
That’s a very interesting point.
Not really but I did not see any.
Puppeteer has no browser extension since it’s a testing suite based on a headless chrome and nodejs. And I expected the network between the monitoring server and the node server and the one from node to mongo (atlas) to be stable and not slow down.
But that reminds me that an increasing latency could have that impact as well. I tested with a node server with a bigger latency due to distance and the number I got was around 3000ms instead of 2000ms.
Another interesting fact that “seems” to show node is still getting it’s data at the same speed as it was is we run a query
We checked another chart that is node doing the same queries as our initial subscribes (but for another user account) and measuring the duration and it’s been stable in the last months.
So:
- On node’s side, doing the queries is not slower than it was
- On my laptop, loading the app does not seem slower than it was
- Using Puppeteer (either on AWS or on the same network as my laptop) seems to have slower and slower performances ONLY for our production environment that uses Atlas and not for our test environment (same servers but different processes) that use a self-hosted mongodb.
That’s weird that testing our test environment (not using Atlas) gives way better results all the time. Is it Atlas? The database has exactly the same content on Atlas than our self-hosted.
I just don’t like the fact that it’s degrading all the time. We’re feeling “stressed” by it since we don’t understand it and can’t know if it’s going to affect users one day or not.
Thanks for your help RJ!
Atlas can be “one of the possible culprits” but from what you have provided, you have not eliminated other factors that might have affected your measurements. If you wanted confirmation that Atlas is the source, you need to remove all external effects.
Ok…
Well… I think we have eliminated everything else:
When we compare our test environment to the production environment, the only difference I can think of is Atlas vs Self-hosted as both node processes are running on the same server and are being tested using the same Puppeteer monitoring system.
The only difference I can think of is the users using the system and creating a load that’s not there but I think it can be eliminated too as a factor because if we look at the performance numbers at night (when nobody is using the system), they should go back to 1200ms if the load would make a difference but they actually don’t vary much.
Do you see any other factor we have not thought about ?
So in my mind, everything points towards Atlas but 2 hints say it does not:
- Our other metric that checks only the duration of 5 queries on the server (not the actual client) has stayed the same.
- On my laptop, it does not seem to have slowed down (or has it but is it just not noticeable because the machine is more powerful ?
So we’re still confused and still worried it might have a user impact one day
The fact that you are confused with differing results meant that you have not eliminated the external factors.
hahaha thanks. We’ll dig deeper !