I was wondering how big (or not so big) the RAM usage of your production Meteor app is …
We are usually having, at peak times, around 150 concurrent users on our production app at Orderlion. We are running our Meteor app in 2 docker containers with a load balancer.
Some of the packages/tech we are using:
Meteor 2.8.1
Grapher 1.4
NO Oplog!
a little bit of GraphQL for our Mobile App
NOT a lot of subscriptions anymore, most of the data is just loaded via Methods calls
→ with the 150 concurrent users our RAM usage is growing constantly! After only 24 hours of running the docker instance, its RAM usage usually grows from ~700MB to 1.5 GB.
We know that we have a little memory leak somewhere, but we are pretty sure this is not the only reason for the RAM explosion.
→ Is RAM usage like this normal for a big production app? Are we missing something? How would you debug this?
PS: We are also pretty sure there is a problem with the new mongo driver (see: Meteor v2.8 - Memory leak in mongo driver?), but for now we are just limiting the connection pools back to 10 as it was with the older mongo driver.
Meteor normally doesn’t leak memory. However a Node.js application can eat about 1.5 GB easily due to how engine allocates memory and it doesn’t depend on how much of it is actually used.
Grapher …
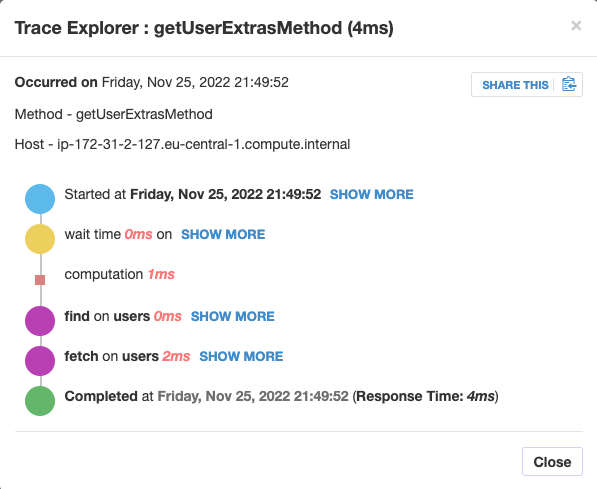
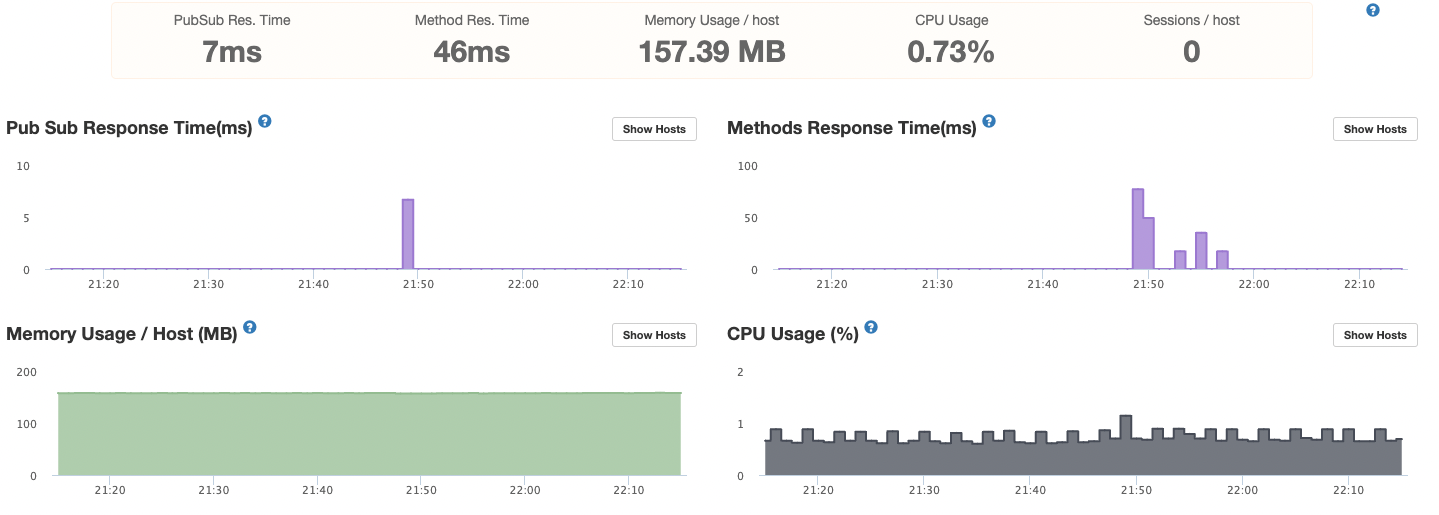
Do you use Monti APM. Can you have a look at a Grapher method and see what it does. I’ll show you an example from my self hosted APM.
A method to just simply get some data from the user, email, display name, and a slug.
Next, a method that gets some wall post of friends and people I follow:
Ok, if you only have 10 connections, you might not be able to even run one Grapher query efficiently.
The question is: what is in those queries. In theory, but this more based on some folklore, 1 connection would take 1MB on your Meteor RAM.
Another thing to consider is that if you have an optimum 100 connections opened but not in use (100MB) your Meteor will reach optimum efficiency because when a query goes out, a connection is already opened. This is an optimization that came with … maybe MongoDB 4 or maybe 5, will need to check the documentation. You can see in the forums after 2020 a lot of people complain about a large number of connections while just a few users are logged in. That is an optimization not a bug.
I think your problem could be one of design and not a problem of code/infrastructure.
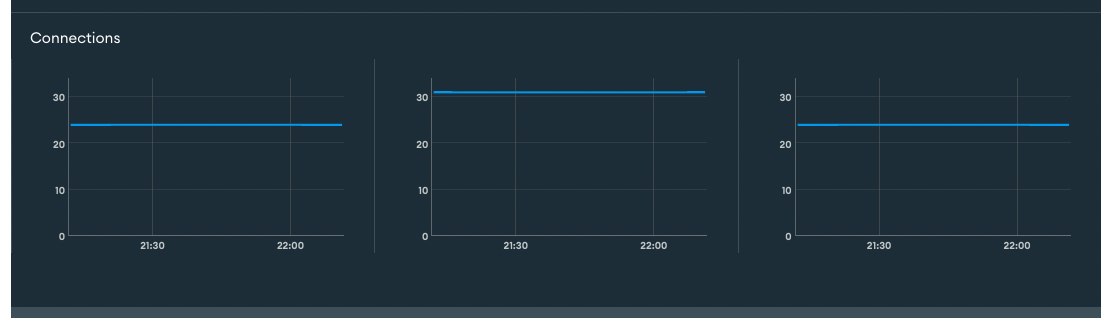
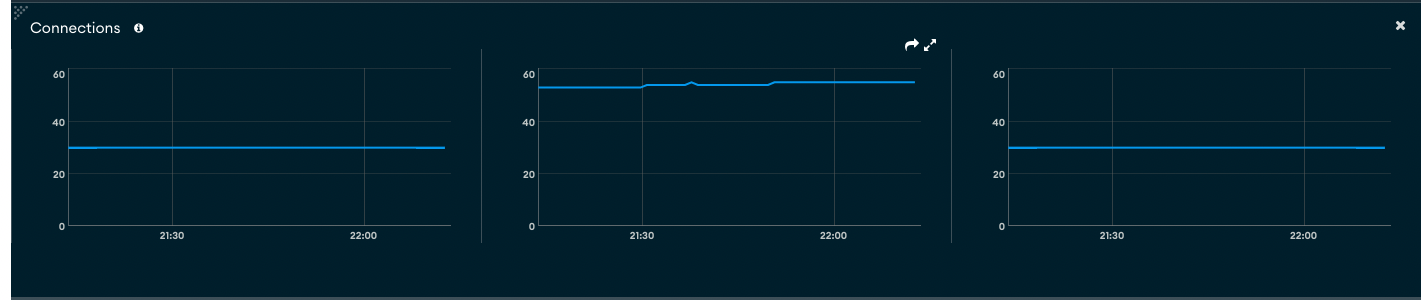
Just to add two other perspectives on the data above. These are with Meteor 2.8.1. While I ran those queries, I was the sole user in my platform (we are not live yet)
Number of Mongo Connections on the Atlas side with 1 app user:
The cluster where I get social posts from
What I am trying to say is that the number of connections is not the problem here, probably, but what runs on them, perhaps some query caching on Grapher, some large mapping over cursors etc.
I’d just add that arbitrarily raising the connection pool limit can have performance impacts, though mostly at the DB layer rather than the app server, since things that were implicitly throttled will no longer be throttled.
We had this issue on a previous meteor upgrade when the default poolsize went from 5 to 10 (or possibly when meteor stopped recognising an option we’d set to force it to 5).
I’m watching these threads pretty closely as we’re about to do the 2.8.1 upgrade - hopefully there is a resolution soon
As outlined in the other thread: for some reason the default pool size for the node mongdb 3.x driver was 10, although the docs say 100. I don’t understand why, but Monti showed a pool of 10 with Meteor 2.5.8 and the older node mongodb driver!
We use Grapher heavily and this pool was enough to serve over 150 concurrent users quite happily without any problems! So your argument that 10 won’t even be enough for a normal grapher call seems to be not valid!
But yeah, I agree:
The fault is definitely somewhere in our code but for some reason it got a lot worse with the new mongo driver. The poolsize does not seem to be a problem, as going back from 100 to 10 did not make a huge difference.
BUT: how to find this damn bug? We analyzed so many heap dumps by now and other stuff but our codebase is quite big, so I am running out of ideas.
So your argument that 10 won’t even be enough for a normal grapher call seems to be not valid!
This argument is not really mine. In my previous message I had this link: MongoDB in production: How connection pool size can bottleneck application scale | by Kyle Martin | Medium which explains the “mechanic” of running queries over a limited number of connections.
You don’t feel it because for the time being you probably don’t have long running queries. With time, as the DB grows, you might start to see fast queries waiting behind slow queries.
Let’s say today a Grapher query takes 30ms. If you get that result in 120ms you “feel” no difference in the user side. Possibly, 300ms makes no difference as well. But that is a 10x slower query result. You are right, today, 10 might be enough. The driver options now are far more appropriate for what we need, I think. I guess you could set 10 for a minimum, 20 for a max and perhaps 2-10 sec to kill a connection.