Last week we upgraded from v2.5.8 to v2.8.0 on our production instance of https://orderlion.com.
Almost immediately the next day, we had our RAM usage explode, resulting in “JS heap out of memory” another day later and forcing the docker container(s) to restart. (we had about +1GB of RAM usage per container per hour! - totally crazy!)
We did some analysis via V8 heap dumps and also via Monti and found the following clues:
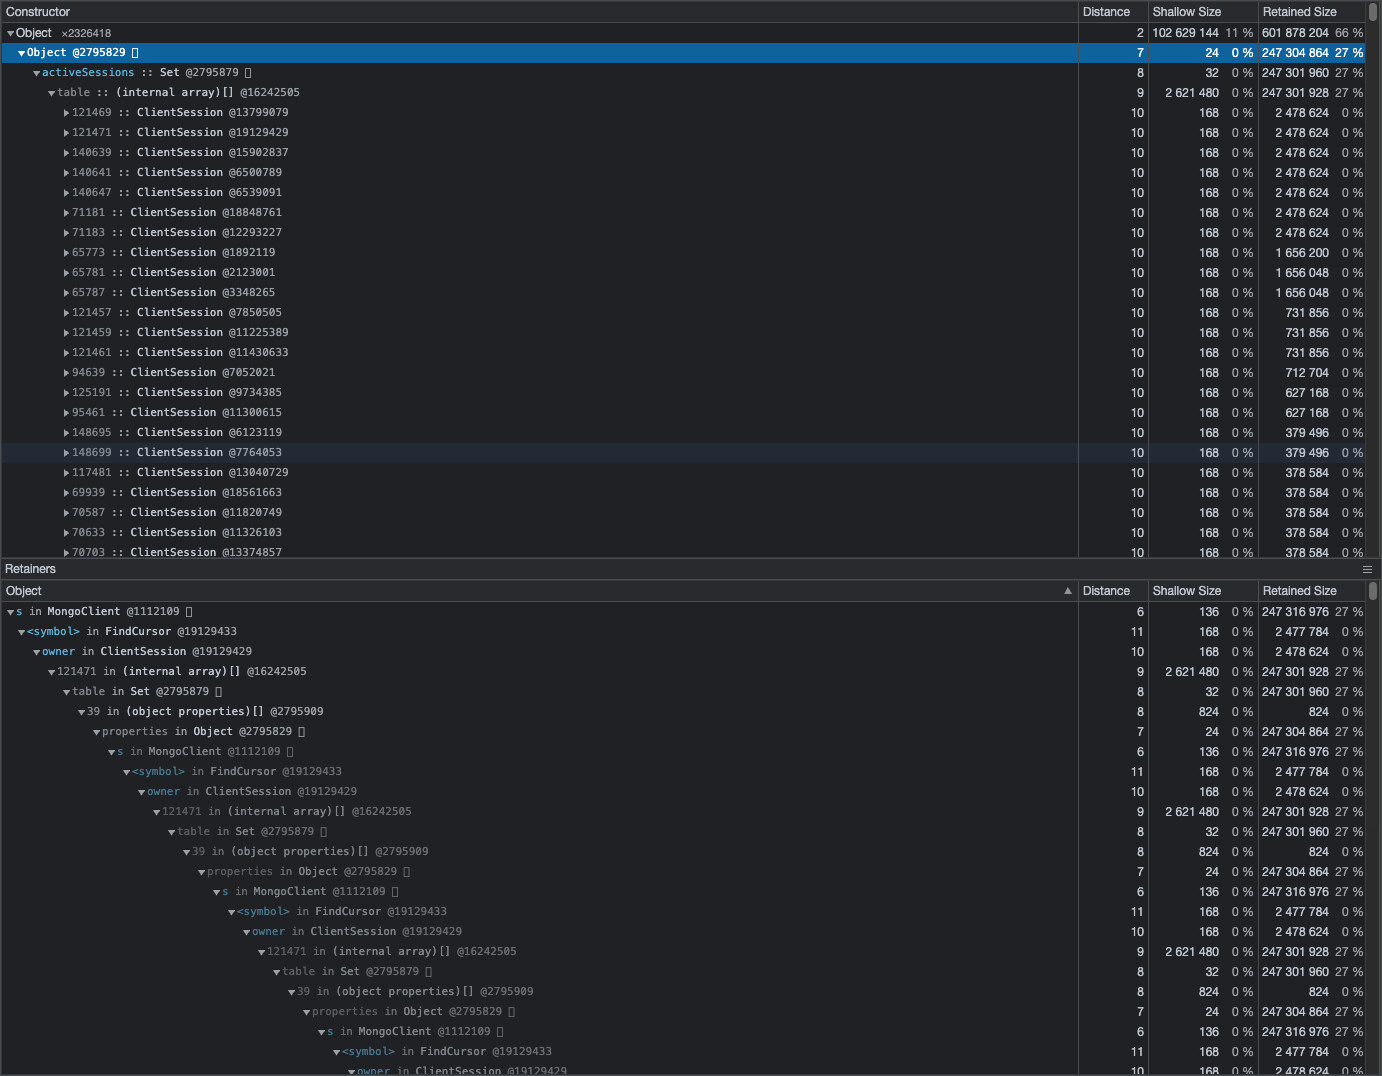
We discovered an extensive amount of ClientSessions and even some circular references which could prevent garbage collection of unused ClientSessions. The amount of ClientSessions and therefore also the allocated memory is growing substantially even after a few hours of being live in production.
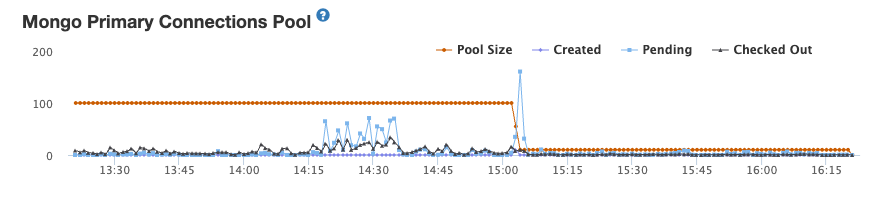
Also, for some reason, the new mongo driver allows way more primary connection pools (10 → 100), which could also bump up the RAM usage even more.
You can see the crazy RAM usage of 247 MB for the MongoDB client sessions - this is a B2B tool, with a maximum of ~150 users online at the same time, so this sounds very crazy to me?
Here you can see the jump back from 100 to 10 mongo connection pools again, because we shipped a downgrade! - we had to roll back our update, as this big pretty much makes this impossible to use for us on production.
Did anyone run into similar problems? I think you guys really need to investigate this! (We also posted the same issue in the MongoDB Jira: https://jira.mongodb.org/browse/NODE-4833)
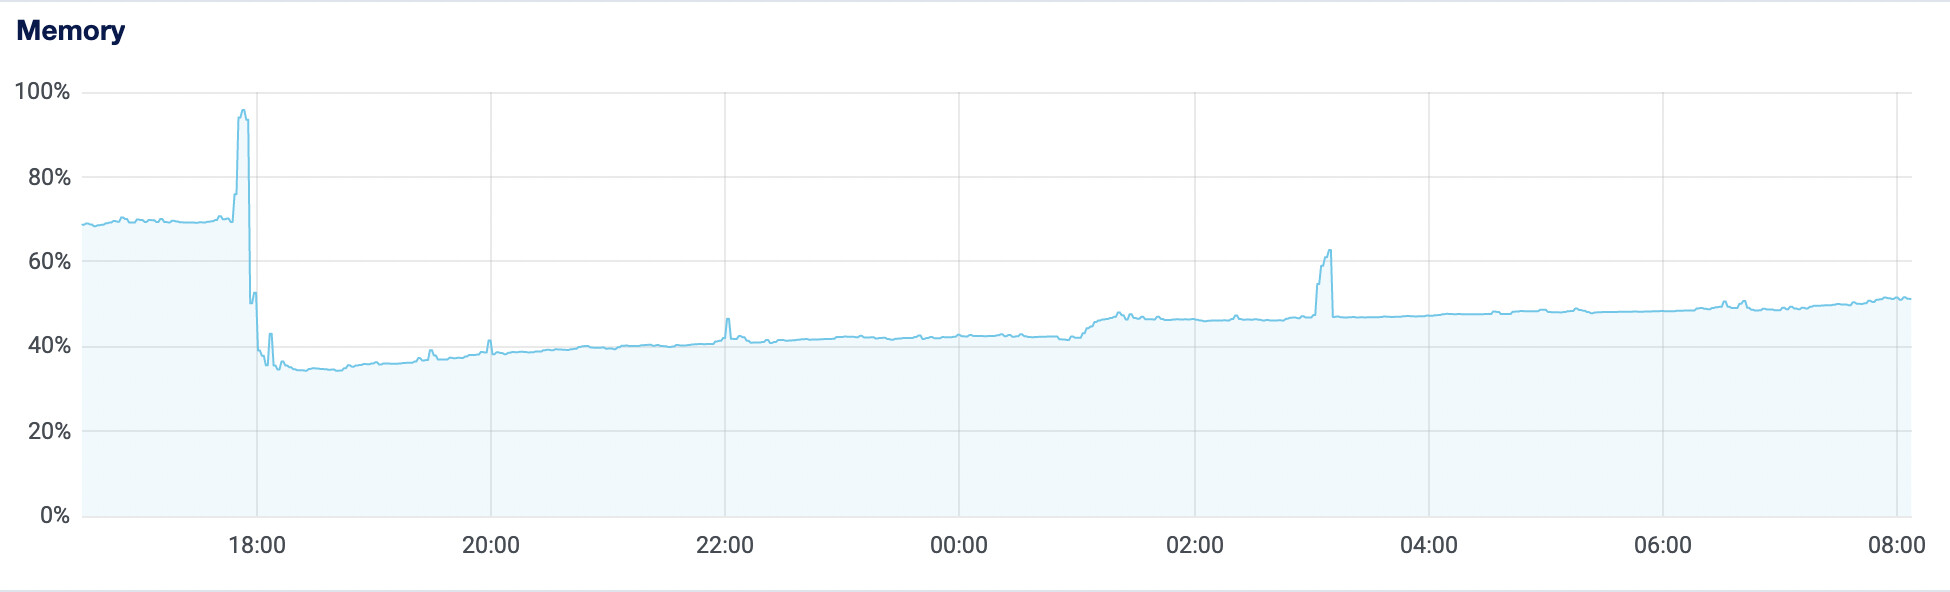
We still see severe RAM usage, although we THINK it got a bit better. But still we will have to docker restart both our containers on a daily basis now - otherwise we just run out of RAM.
Here you can see the RAM growth during last night (the spike at 6pm yesterday was our release) - it grew from ~35% to 52% in just 14 hours during the night, where there are obviously next to no users online/using the app!
Do you get deprecation notice for socketTimeoutMS. I remember it has been sent to the history of computing a long time ago. It could be that you don’t even get a deprecation message anymore. I’d suggest to check if that exists on your version of Mongo Driver.
Here’s an example of parameters for the current driver (might have used this since at least Meteor 2.7):
Yes, the settings work. I don’t know why you think these are deprecated, they are still well documented in the official mongodb node driver: MongoOptions | mongodb
We are absolutely sure that “something big” changed with the update of the MongoDB driver, as the RAM usage just exploded, as outlined above, with a lot of ClientSessions in RAM which just grows and grows.
Does anyone have tipps on how to find cursors which, apparently, can’t be closed and thus mean that the according ClientSession stays open indefinitely (resulting in our RAM explosion)?
@radekmie might be able to give a clue if there is anything that might have caused a circular reference with instantiating a ClientSession as indicated in the heap dump above
We can try maxIdleTimeMS, but the problem I see is: The leak does NOT originate from too many connections or connections staying open/not being closed - the problem are the Sessions that are never being “freed” and never being deleted.
I just analyzed our heapdump again and it seems to me, that the ClientSessions contain pretty much everything!
You can find references to the Grapher package, the Accounts package, … you name it.
Maybe this is expected behavior, I don’t know, it is very hard for me to follow any logic here. What is definitely true is, that these ClientSessions seem to be never cleaned up and thus make the RAM grow indefinitely.
the memory impact itself was tiny though - running the above 4 times (in different variations) - e.g., 4000 extraneous active sessions only led to a 25MB increase in memory
Looks like there is an issue specifically with count - the same happens with Meteor.users.rawCollection() - so it smells like an issue with the underlying mongo driver.
It’s worth noting I’m running an EXTREMELY customised version of meteor - reproing on the base 2.8.1 would be useful (and should be easy). I also didn’t try running this pre 2.8 to see if it’s pre-existing
I’d bet money on the problem being that count (which is now deprecated) doesn’t close the session
there are two variations of sessions in the Node driver. Every operation that gets sent to the server has a session attached - we represent these sessions with ServerSessions. The driver manages ServerSessions in a ServerSessionPool and will clean up stale server sessions when they expire. ClientSessions are an abstraction over ServerSessions that allow users of the driver to provide a session for operations. The driver does not manage ClientSessions - users are responsible for ending them using the endSession method.
We allow users to create sessions using the MongoClient’s startSession method (source here). This method ensures that when endSessions is called, we remove the client session from the ActiveSession set.
The reported bug is a buildup of ClientSessions. My suspicion (without knowing how Meteor works) is that Meteor is creating client sessions under the hood but never ending the sessions, resulting in a buildup of sessions in the driver.
Does anybody have any infos on this?
What totally confuses me: I checked both the meteor (packages) codebase AND the meteor grapher codebase: In neither (besides one single test) could I find a call of startSession() … wtf is going on? What am I missing here?
if you don’t provide a session, the driver creates one automatically - this is cleaned up anytime a cursor is invoked (and ran to completion) but not when a count is called - I also wonder about things like distinct or index creation that also wouldn’t use a cursor
So, it seems to me that, for some reason, for some operations this is not handled properly by the mongo driver? Maybe especially aggregations are affected heavily (which are used A LOT by Grapher) and that’s why only some Meteor users are affected by this bug?!
In any case, we really need a fix for this asap! Thanks everyone again for all your help and input!
so that is the code that start’s the session, but not what ends it (but it probably should be what ends it) aggregations (at least on a rawCollection) don’t trigger this - probably because the result is a cursor.
Aside: I thought grapher didnt use aggregations - but used hypernova for a custom lookup algo?
FYI I checked aggregation, createIndex and distinct - none of them had this issue…
Ok, so technically this is a bug in the mongo driver (rawCollection.find().count() does leak the session) - but since that’s deprecated anyway they probably don’t care.
The issue is that meteor uses rawCollection().countDocuments({}) - BUT they use it after creating the cursor - so the fault is with meteor
Exactly. To be clear, this is certainly leaking sessions. It’s not obvious that this is the root cause of the memory leak (in my tests the memory leak was pretty modest)