Hello, recently I upgraded our app to Meteor 3 and app performance took a hit.
My app is deployed to a self managed server using meteor-up.
When checking the server using lazydocker, there are errors like Javascript heap out of memory and Mongo Pool Connection error.
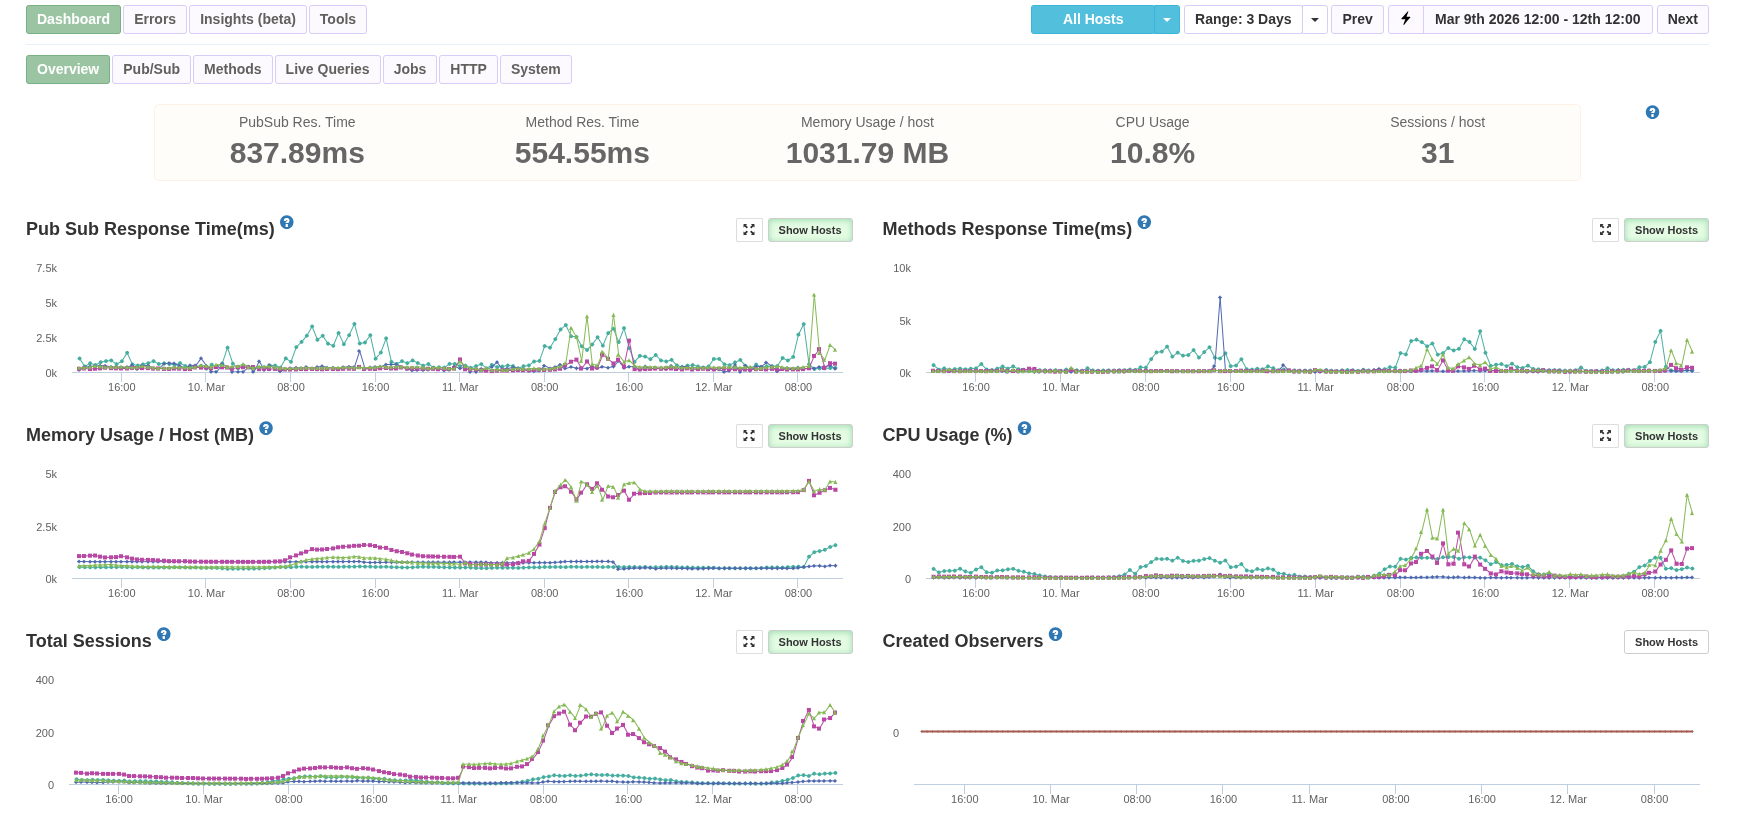
MontiAPM shows a huge increases in memory usage and total sessions after the meteor 3 deployment, screenshot below.
I think there might be a memory leak, though not sure where to start looking and how.
Any ideas?
Thanks
What is your mongo pool maxSize?
I have maxPoolSize=150
Try lowering that, for example setting to 25. Then tune / increase the size after measuring resource usage.
This will obviously throttle db operations and potentially increase pool queue size and checkout times.
But start somewhere lower, then tune from there.
I will try that, but still why would that causes such a huge different between Meteor 2 and 3?
The mongodb settings on Atlas is unchanged.
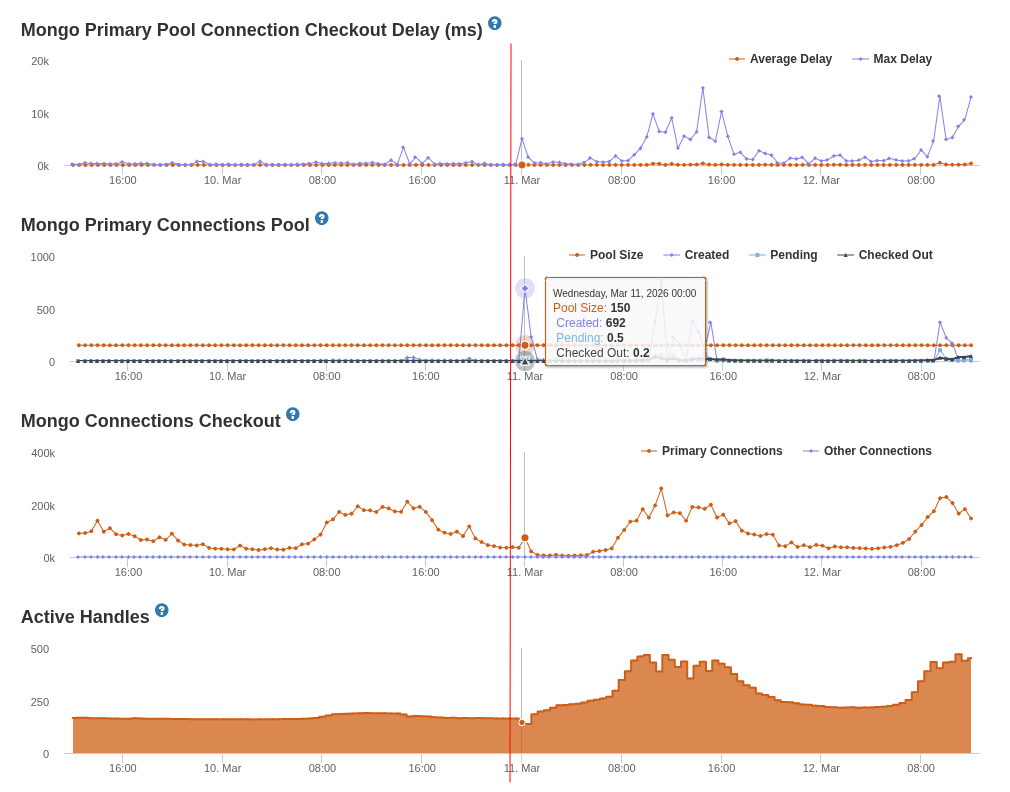
Here is the screenshot on MontiAPM for the Mongo pool size and checkout times. The red vertical line is when the app is upgraded to Meteor 3.
Which version of Meteor 3.x are you using?
I’m using Meteor 3.4
Do you use any third-party atmosphere package on your app? publish-composite, redis-oplog, reactive-aggregate or any other data or jobs related package?
It would be nice to see the packages that you use for your app.
In the first screenshot, I noticed that the number of sessions also increased at the same time you switched to Meteor 3. It makes it difficult to know if the changes in metrics are related to the Meteor release, or to the number of sessions. I do notice, though, that in Meteor 2, the memory usage was related to the number of sessions - when the sessions decreased, the memory decreased. However, with Meteor 3.4, the memory doesn’t significantly decrease when the sessions decrease. You could be right that there is a memory leak.
For the high cpu usage, it does seem related to the number of sessions: it does go down when the sessions go down. If you are using continuous cpu profiling, you can look at what was causing the high cpu usage.
I’m working on some new tools to help with memory leaks. If you send me a message with the app you are monitoring, I can give you early access.
1 Like
@nachocodoner yes I do use publish-composite and redis-oplog and strigops:job-collection
Here is my packages file
cultofcoders:redis-oplog
disable-oplog@1.0.8
meteor-base@1.5.2             # Packages every Meteor app needs to have
mobile-experience@1.1.2       # Packages for a great mobile UX
mongo@2.2.0                   # The database Meteor supports right now
reactive-var@1.0.13            # Reactive variable for tracker

standard-minifier-css@1.10.0   # CSS minifier run for production mode
standard-minifier-js@3.2.0    # JS minifier run for production mode
es5-shim@4.8.1                # ECMAScript 5 compatibility for older browsers
ecmascript@0.17.0              # Enable ECMAScript2015+ syntax in app code
typescript@5.9.3              # Enable TypeScript syntax in .ts and .tsx modules
shell-server@0.7.0            # Server-side component of the `meteor shell` command
hot-module-replacement@0.5.4  # Update client in development without reloading the page

static-html@1.5.0             # Define static page content in .html files
react-meteor-data       # React higher-order component for reactively tracking Meteor data
accounts-password@3.2.2
ccorcos:subs-cache
montiapm:agent
aldeed:simple-schema
reywood:publish-composite
ferjep:persistent-session
session@1.2.2
strigops:job-collection
montiapm:profiler
Thanks for your input, I sent you a message.
it’s a interesting insight since I got a similar behavior testing oplog vs change streams, getting OOM while stress oplog
can you simulate this behavior outside production? so we can test 3.5-beta and confirm the possible memory leak is in oplog module(or not)
I think I got it:
Meteor 2 — collection.js:481 :
sub.onStop(function() {
  observeHandle.stop();  // SYNC — Fibers block until completion
});
Meteor 3 — collection.js:133 :
sub.onStop(async function() {
  return await observeHandle.stop();  // ASYNC — return Promise
});
But _callStopCallbacks is not update :
_callStopCallbacks: function () {
  var callbacks = self._stopCallbacks;
  self._stopCallbacks = [];
  callbacks.forEach(function (callback) {
    callback();  // ← Promise return but ignored
  });
}
Let me test and I’ll open a PR if it’s the problem
Thanks for looking into this everyone, so I actually found out the reason why Memory and CPU usage were so high.
Turns out in Meteor 2, I had meteorhacks:cluster so the app utilizing all the cores on our servers.
While upgrading to Meteor 3, I removed it because of the package constraint with webapp makes it incompatible with Meteor 3.
Cloned meteorhacks:cluster locally and updated its package.js to make it works with Meteor 3 and now metrics are looking good again.
Yes, when using third-party packages it’s good to, if you experience really weird behavior in consumption, incrementally silence all those extra parts. That can help you find the culprit once you see the behavior stop happening (or appearing! just like in your use case).
In normal apps, we have been monitoring this and the experience you reported did not happen to us, so with high probability the reason was an extra package causing those bad behaviors, which is why we asked about it, or a very edge case in the core that we are not aware of, and could we fix for the core. Apparently we got one. Even with a different cause, it’s nice to explore and fix other inconsistencies.
But this is still very generic but worth for anybody running into these issues. In your case, as you described, that package had been removed and the effect was the opposite. It was needed for load balancing as the purpose of the package and had to exist to balance the metrics back on previous versions.
meteorhacks:cluster could be resurrected (11 years ago last release!) and migrated to Meteor 3.
You mentioned that you had to update it in a cloned copy, at least to get minimum compatibility. Would you like to publish that version so others can use it too?
I think it’s way better to use something like pm2 (one-line pm2 start main.js -i max --name "meteor-app" and configure nginx to use sticky sessions ![]()
1 Like
Good suggestion for the multi-core case. But looking at the meteorhacks:cluster package (not really experienced with it though), PM2 + Nginx might not cover everything teams were relying on like:
- Auto-registration when adding or removing instances
- Any instance being able to act as a balancer, avoiding a single point of failure
- DDP-aware inter-instance proxying
Cluster.discoverConnection()for microservice setups
If any of those were in use, the migration effort could be non-trivial for a production app. There could be production apps that used meteorhacks:cluster purely for multi-core and never touched the other features, in which case PM2 would be a fine replacement. A simpler, less overengineered approach may be enough, and that is true. But that doesn’t mean the migration will be easy, or that metric behavior in their app won’t be off during the transition until they fully understand the new setup vs meteorhacks:cluster’s specifics.
Having a minimally compatible Meteor 3 version as a first step, while teams assess what they actually need, seems like the safer path in short term.
1 Like
You’re right, I was mostly looking at the multi-core angle
For apps that only used meteorhacks:cluster to spread load across CPU cores, PM2 + Nginx is probably enough. But for apps that depended on the package-specific features like auto-registration, DDP-aware proxying, or discoverConnection(), that is a different story indeed ![]()
My main concern is that the package appears to do fairly invasive monkey-patching of DDP and WebApp internals. In Meteor 3, with the async changes, that feels like the kind of thing that can easily become fragile across upgrades
So I could see value in a minimally compatible Meteor 3 version as a migration path, I can inspect the code a bit and report back on how realistic that port would be ![]()
2 Likes
They were at least able to get the package working in their app again, with the metrics showing properly too, likely as an effect of proper load balancing again on their app. So they may have reached the minimum compatibility needed.
There could still be other edges that need attention, so any extra input would be great, just in case there are more fixes to cover. ![]()