Meteor 3 Performance: Wins, Challenges and the Path Forward

Motivation

After the Meteor 3 launch, we planned our next steps, our roadmap is public. Before introducing new features or packages to the framework, we will focus on quality checks. Alongside the new Meteor patches, we are addressing issues and starting to measure Meteor 3’s performance following this major update.

To measure performance effectively, we need a suite that tests the same behaviors in both Meteor 2 and 3. This will help us identify performance regressions and ensure future versions maintain or improve performance. This tool is new for us, and combined with other performance measurement plans, it should prevent any decline in performance.

Since Meteor 3.0.1, we have been developing a tool for basic performance measurement, meteor/performance. This repository also serves as inspiration for adapting scripts and performing performance analysis on your own applications.

Methodology

We use Artillery to apply configurable stress tests on our test machine and Playwright to simulate interactions with Meteor apps on every initiated connection.

Our testing follows an incremental approach, starting with a simple setup before progressing to real app scenarios. Addressing issues in simpler cases allows us to tackle isolated performance problems, often leading to improvements in more complex scenarios, as they rely on the same primitives. We have observed that even in a basic setup, performance regressions related to reactivity handling happen.

Our simple setup involves two apps, tasks-2.x and tasks-3.x, that:

  • Create 20 connection-scoped tasks via a button and a Meteor method.
  • Remove each of the 20 tasks one by one via a button and a Meteor method.
  • Display all tasks:
    • Using one Meteor subscription (reactive scenario)
    • Using one Meteor method that fetches them with each action (non-reactive scenario)

During stress testing, limited by the test machine capacity, 240 connections were established within one minute, averaging 4 connections per second. Each connection ran the specified processes: adding, removing, and fetching tasks in both reactive and non-reactive modes from all other connections, leading to overload.

Results

Our results indicate that:

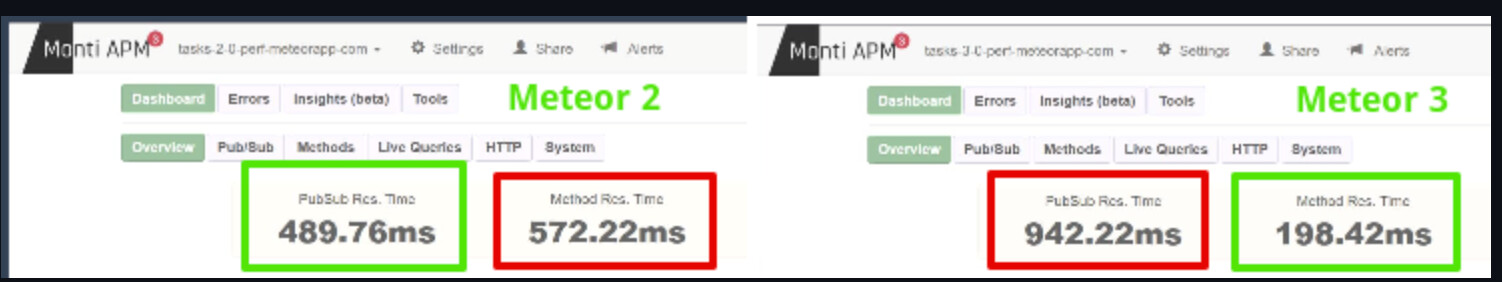
Meteor 3 is on average ~28% faster, uses ~10% less CPU, and ~16% less RAM in a non-reactive scenario. It handled all 240 connections smoothly.

Meteor 3 is on average about the same in time, uses ~18% less CPU, and ~10% more RAM in a reactive scenario. However, it supports fewer connections per minute (180 or 3 per second), indicating a performance regression.

For more details on performance setup, machine configuration, and load options, visit the report at benchmarks/meteor2.16-vs-3.0.1

The good news is that for most processes in Meteor 3 apps, you can expect faster performance and lower resource consumption, likely due to the Node upgrade, particularly in non-reactive scenarios.

The bad news is a specific regression in processes involving live data mechanisms, Meteor 3 supported fewer connections on reactive mode. This issue appears to be poorly handled, and we are committed to fixing it to achieve at least 240 connections per minute (4 per second) on the testing machine as Meteor 2.

With the Meteor 3.0.3 release, we continued our analysis to understand the regression. We found that disabling compression can benefit both Meteor 2 and 3, particularly Meteor 3, by reducing container stress and allowing more connections per minute, aligning with Meteor 2 performance. However, while this helps, it doesn’t address the root cause of the regression, so further research and fixes are needed.

More details on how to benefit from disabling compression can be found at benchmarks/meteor2.16-vs-3.0.3-disable-compression.

Hypothesis on the Challenge

Further analysis of APM metrics indicates that the issue in Meteor 3 could be due to the event loop saturation, high async resource usage, and more frequent garbage collector activity. This can be more problematic with apps that heavily rely on reactivity and advanced methods to manage it, like publish-composite.

We will keep investigating this problem to gather more information and explore potential solutions.

Call to Action

We encourage Meteor developers to share us feedback on their application performance in Meteor 3.

  • Have you noticed a regression in your reactive data?
  • Do you use high-intensity reactive libraries like publish-composite?
  • Do you use redis-oplog?

We are seeking more scenarios from your applications to analyze. Some of you have already reached out to us privately about your issues. We are working to identify improvements and the core fix, and we will continue to gather information and reports to better define the problem.

13 Likes

To clarify, the difference between 180 and 240 connections per minute isn’t rigid. Meteor 3 performance drops in reactive scenarios, but on this specific test machine, it would handle between 180-240 connections, depending the interval and the amount they are coming. We use these numbers because our artillery load config initiates connections per second: 3 per second equals 180 per minute, and 4 per second equals 240.

1 Like

What are the objects that garbage collector has to work so much to remove? Why they appear now with async and wasn’t there with fibers? Did you try to compare memory dumps between v2 and v3?

3 Likes

@nachocodoner, fantastic work on this.

Do you have visibility what load Meteor 2.x starts to throttle/degrade significantly? That should be the same limit as Meteor 3.x, right?

e.g.

Meteor 2.x
3/s - ok
4/s - ok
5/s - ok
6/s - not ok

Meteor 3.x
3/s - ok
4/s - not ok

In the example above, Meteor 3.x should also achieve “5/s - ok” and not only “4/s - ok.”

Does this make sense?

2 Likes

It’s good to see work in this direction.

@nachocodoner, could you share the container size and underlying AWS hardware for these containers? How many containers were used? Did you perform a test increasing/decreasing the number of containers? And did you use Redis oplog instead of MongoDB oplog to improve horizontal scaling?

More details would make testing and comparing results in different production environments easier. Also, they would be comparable results.

Did you test using Artillery + AWS Fargate to launch many clients, like 1000s?

Many Meteor apps handle thousands of connections well so that these companies would appreciate this comparison.

We’ve run similar tests for clients privately. If you share more details about the underlying hardware and container sizes used in your tests, we can replicate them in our infrastructure and compare results.


To illustrate how hardware impacts test results, we run Meteor apps on six different hardware setups across various cloud providers (we run private regions for clients who can choose any Cloud provider and region in the World). The differences are significant.

Recently, we migrated a client from one provider to another, reducing publication and method response times by 50% (up to 80% for some methods). This improvement came solely from changing the underlying hardware, with no code or container size changes.

We’ve seen even more significant performance gains in some cases, depending on the client’s original provider.

3 Likes

The main issue seems to be the garbage collector struggling with the large number of async resources being generated, especially due to observer logic. Profiles show thousands of memory allocations, with Meteor 3 showing increased pressure in async management and GC processing.

In Meteor 3, with the change to async operations, many short-lived objects are created. These objects put significant preassure on the garbage collector, as they require frequent allocation and deallocation. The issue wasn’t as impactful with fibers, likely because their concurrency model didn’t create as many resources. Optimizing async resource creation and handling should alliviate the pressure on garbage collection, but this is still a hypothesis based on the current metrics, we need further research on detailed metrics.

As you mentioned, we can compare memory dumps between Meteor 2 and 3 using the same apps and processes involved on the benchmark to gather more evidence. We’ll work on this next to confirm the hypothesis and check for any other causes of the regression.

2 Likes

In the benchmark peformed, we ran the same process with identical isomorphic code on both Meteor 2 and Meteor 3 engines.

To achieve equivalent performance, both should handle the same number of connections per second with the same machine setup and environment. If they do, then better timing indicates improved performance, as seen in our benchmark with the non-reactive scenario.

In the example you provided, yes, Meteor 3.x should also meet the “5/s - ok” as Meteor 2.x,making them comparable on other metrics. If not, it suggests that the engine with better connections per second performs better. Since it doesn’t, this indicates a performance regression. Meteor 3 appears to use more resources, leading to slowdowns and reduced performance in reactive processes.

3 Likes

I want to clarify the purpose of the benchmark performed by us. There are two main goals: first, to identify regressions between Meteor 2 and 3 and prevent backward steps in the future by performing QA checks on the core changes in new versions; and second, to analyze the reported metrics, implement changes, and verify improvements.

As our purpose is to compare Meteor 2 and 3. We began by testing incrementally in isolated environments, creating small apps and applying the same code and processes for stress testing on a local machine and single remote container. In the report you can find more details about the specs on these. Identifying regressions in these smaller environments allows us to reproduce and address at least one issue, which in turn helps with other related issues since they rely on the same foundations. After resolving initial regressions, we will increase the complexity of the test setup to cover a broader range of potential issues in different core areas.

Your proposal to test in a more complex setup hasn’t arrived yet. From what I understand, it seems your tests have focused on improving Meteor app performance with the same app version, and optimizing the DevOps side.

We understand the importance of infrastructure and scaling strategies to improve performance for apps, as these factors can push apps beyond the limits of core engines. Although hardware, network setup (regions/latency), resource setup (CDN), and scaling (vertical/horizontal) can impact performance, our current benchmark focuses on evaluating the core software engine alone. This approach helps us identify and address regressions between Meteor 2 and 3 more efficiently. Even a simple infrastructure setup can reveal deficiencies in the Meteor 3 engine, regardless of complexity.

If you’d like to contribute to this benchmark effort, your help is appreciated. You can clone the repo and run stress tests on the small apps using your own infrastructure. Alternatively, comparing the same behaviors of real-world apps using Meteor 2 and 3 would be useful. Your feedback can help us understand and improve the Meteor engine, particularly in identifying and addressing the reactivity regressions.

3 Likes

Where can I find the container and hardware specifications? I only see specs from a local test on a machine that’s not typically used for servers, so I don’t think this is meaningful for this type of test.

The remote section doesn’t provide any information about container or hardware specs, making it difficult to reproduce a comparable test.

Yes, my friend, we would like to help, that is why I asked for more details so we can run in a similar environment.


About this specific screenshot:

Have you checked the event loop metrics in the System tab? How do they differ between these two runs?

1 Like

I tested with 1GB RAM and 1 zCPU on zCloud (this container is also running MongoDB).

I want to confirm these tests are valid before we rerun them with the isolated MongoDB + MontiAPM agent.

TL;DR: Meteor 3 didn’t crash at 1 minute / 180 connections.

@nachocodoner, do you have any ideas why? Would you like to discuss this further via call or chat? I’m happy to help in whatever way works best for you.

Could the MontiAPM agent be causing the crash? This is just a guess, not based on evidence. I’ll investigate further tomorrow after getting Nacho’s feedback. Also, running with MontiAPM agent will answer this question :smiley:


Non-reactive (duration 60):

Meteor 2:
2 minutes, 30 seconds
browser.http_requests: … 240
Max memory collected (using zCloud container metrics): 461MB
Max CPU usage collected (using zCloud container metrics): 120%

Meteor 3:
2 minutes, 30 seconds
browser.http_requests: … 240
Max memory collected (using zCloud container metrics): 383MB
Max CPU usage collected (using zCloud container metrics): 61%

Reactive (duration 30):

Meteor 2:
2 minutes, 22 seconds
browser.http_requests: … 120
Max memory collected (using zCloud container metrics): 377MB
Max CPU usage collected (using zCloud container metrics): 26%

Meteor 3:
2 minutes, 22 seconds
browser.http_requests: … 120
Max memory collected (using zCloud container metrics): 342MB
Max CPU usage collected (using zCloud container metrics): 22%

Reactive (duration 60):

Meteor 2:
2 minutes, 52 seconds
browser.http_requests: … 240
Max memory collected (using zCloud container metrics): 501MB
Max CPU usage collected (using zCloud container metrics): 72%

Meteor 3:
2 minutes, 52 seconds
browser.http_requests: … 240
Max memory collected (using zCloud container metrics): 494MB
Max CPU usage collected (using zCloud container metrics): 60%

3 Likes

Yes, you’re right @filipenevola. Only local machine specs were included initially, but I’ve updated them. We used 512MB and 0.5 CPUs from Galaxy for the comparison between Meteor 2 and 3 flows.

The results you’re seeing might be due to the larger machine not being fully saturated, based on the artillery configuration. When the machine handles connections comfortably, Meteor 2 and 3 perform similarly, as noted in my local machine report. It’s only under higher load, when they compete for resources, that Meteor 3 shows its weaknesses with reactive loads. You could try a different container size or tweak your configuration to push it into an overloaded state.

Could the MontiAPM agent be causing the crash? This is just a guess, not based on evidence. I’ll investigate further tomorrow after getting Nacho’s feedback. Also, running with MontiAPM agent will answer this question :smiley:

MontiAPM affects the setup. We first ran local tests without it, confirmed the issue, and then gathered more details remotely. For a remote-first setup, I recommend disabling MontiAPM initially, especially continuous profiling, as it adds extra load. Once confirmed, you can enable it for more insights.

We can discuss this further on a call, as you suggested would definitely help to align and dive deeper into the details. :smile:

1 Like

512MB seems a bit on the low side. It could be that the fixed cost for memory is enough to trigger very frequent GC and in that case Meteor 2 performs slightly better but it could be in real world bigger container there is no difference. Maybe better to try at least 1GB and slightly increased load to see if the difference can still be reproduced.

2 Likes

Thank you for your feedback.

I understand your point. Just to clarify, we used a local-first approach with a fixed machine, as outlined in the reports. It had 64GB of RAM (software capped this memory at its limit), and we noticed the same issue: Meteor 3 performs worse than Meteor 2, with methods running faster and subscriptions being the slowest. Testing with a remote machine (512MB RAM) confirmed this behavior, and later we gathered more metrics using APM here.

The main takeaway is that regardless of machine specs, the issue happens when the app gets overloaded. While this might not affect most apps, it could be common for those that rely heavily on reactivity. Better specs or more containers can help spread the load, but the focus here is comparing the code of Meteor 3 and 2, and ensuring performance is at least on par with Meteor 2 under the same conditions. It might be worth trying a remote-first setup with 1GB RAM to see if the issue persists anyway. I think it will perform the same, just with less connections configured in artillery as our 64GB scenario.

We’ll revisit performance improvements soon after we forward Meteor version 3.0.4. We’ve noted the feedback and have additional analysis and ideas of further debugging in mind.

2 Likes