Thanks for your reply! Right now I am still using express via a npm package, since this was neccessary in 2.16. Now as Meteor uses built in express, I will refactor this to use WebApp.handlers; at least that’s what i tried. In the github issue related to the post you mentioned you’ll find a repo with a branch that shows, that there are issues related to montiapm:agent, if you do WebApp.handlers.use().
So I will play around with rawHandlers to see if this helps, so I can upgrade to 3.1.
I’m analyzing a heapdump comparison of my Meteor app and noticed a significant number of Date objects remaining in memory. Namely those are _createdAt meta data properties from documents in my db, traced through MongoDB’s OplogObserveDriver, _observeDriver, and related internal mechanisms.
It appears these Date objects are part of observed collections or documents in Mongo, and they’re not being released from RAM. While these may involve observeChanges or similar reactive mechanisms, the total retained size is growing significantly. (Alloc size is a 27MB increase via a delta of 270k new Date objects.)
Yes maybe, although I’m not sure whether this is due to my implementation or an effect that’s originated in the core of meteor. I also find it hard to reproduce, since it only becomes obvious on busy server. Is there a best practice solution on how to emulate load on a dev/staging server?
Don’t have any experiences yet with artillery, but it sounds fun; will give it a try. In the meantime I will check if 3.1.1-beta.1 will help on that issue; I can upgrade now, thanks to @zodern’s latest update of montiapm agent beta 10.
Update: Just tried to run my server tests on github; however, they fail due to reached heap limit (2GB). Never had a memory issue on mocha tests before.
As I understand, the memory leaks in your project began appearing between versions 2.16 and 3.0.4, correct? Are you saying 3.1.1-beta.1 made things worse, or was the issue already significant? Did this occur as part of your app’s runtime?
You now mention issues with server tests. Are you referring to problems when running meteor test or meteor test-package, right? Did this also happen with version 3.0.4? Are the memory issues reaching heap limits consistently? Does it occur repeatedly during local runs? Did your CI pipeline previously cache data? I’ve encountered test-related issues that resolved after adjusting CI caching. Meteor caches data during test runs, making subsequent runs faster and less resource consumption, especially for large projects. Could this be similar for your setup in 2.x and could be failing now on 3.x?
I haven’t experienced memory leaks with Meteor 3. This might be related to a package or specific setup of your app. Could you share a list of the packages you’re using? You can also reach out privately on the forums if you prefer. On your end, try removing packages incrementally to isolate the issue in both runtime and server tests. For example, temporarily remove montiapm-agent and observe any improvements, continue with other packages that can easily be removed or adapt those quickly.
Keep us updated as you troubleshoot. Your feedback on the migration to 3.0 is valuable and will help others.
Yes, the leaks started right after upgrading from 2.16 to 3.0.4.
I couldn’t test 3.1.1-beta.1 yet, since my CI/CD requires all tests to pass before deployment, and tests via meteor test and mocha fail due to insufficient memory (no issue on 3.0.4, neither 3.1.0). I will check wether local tests also fail. I have no caching in my ci pipeline.
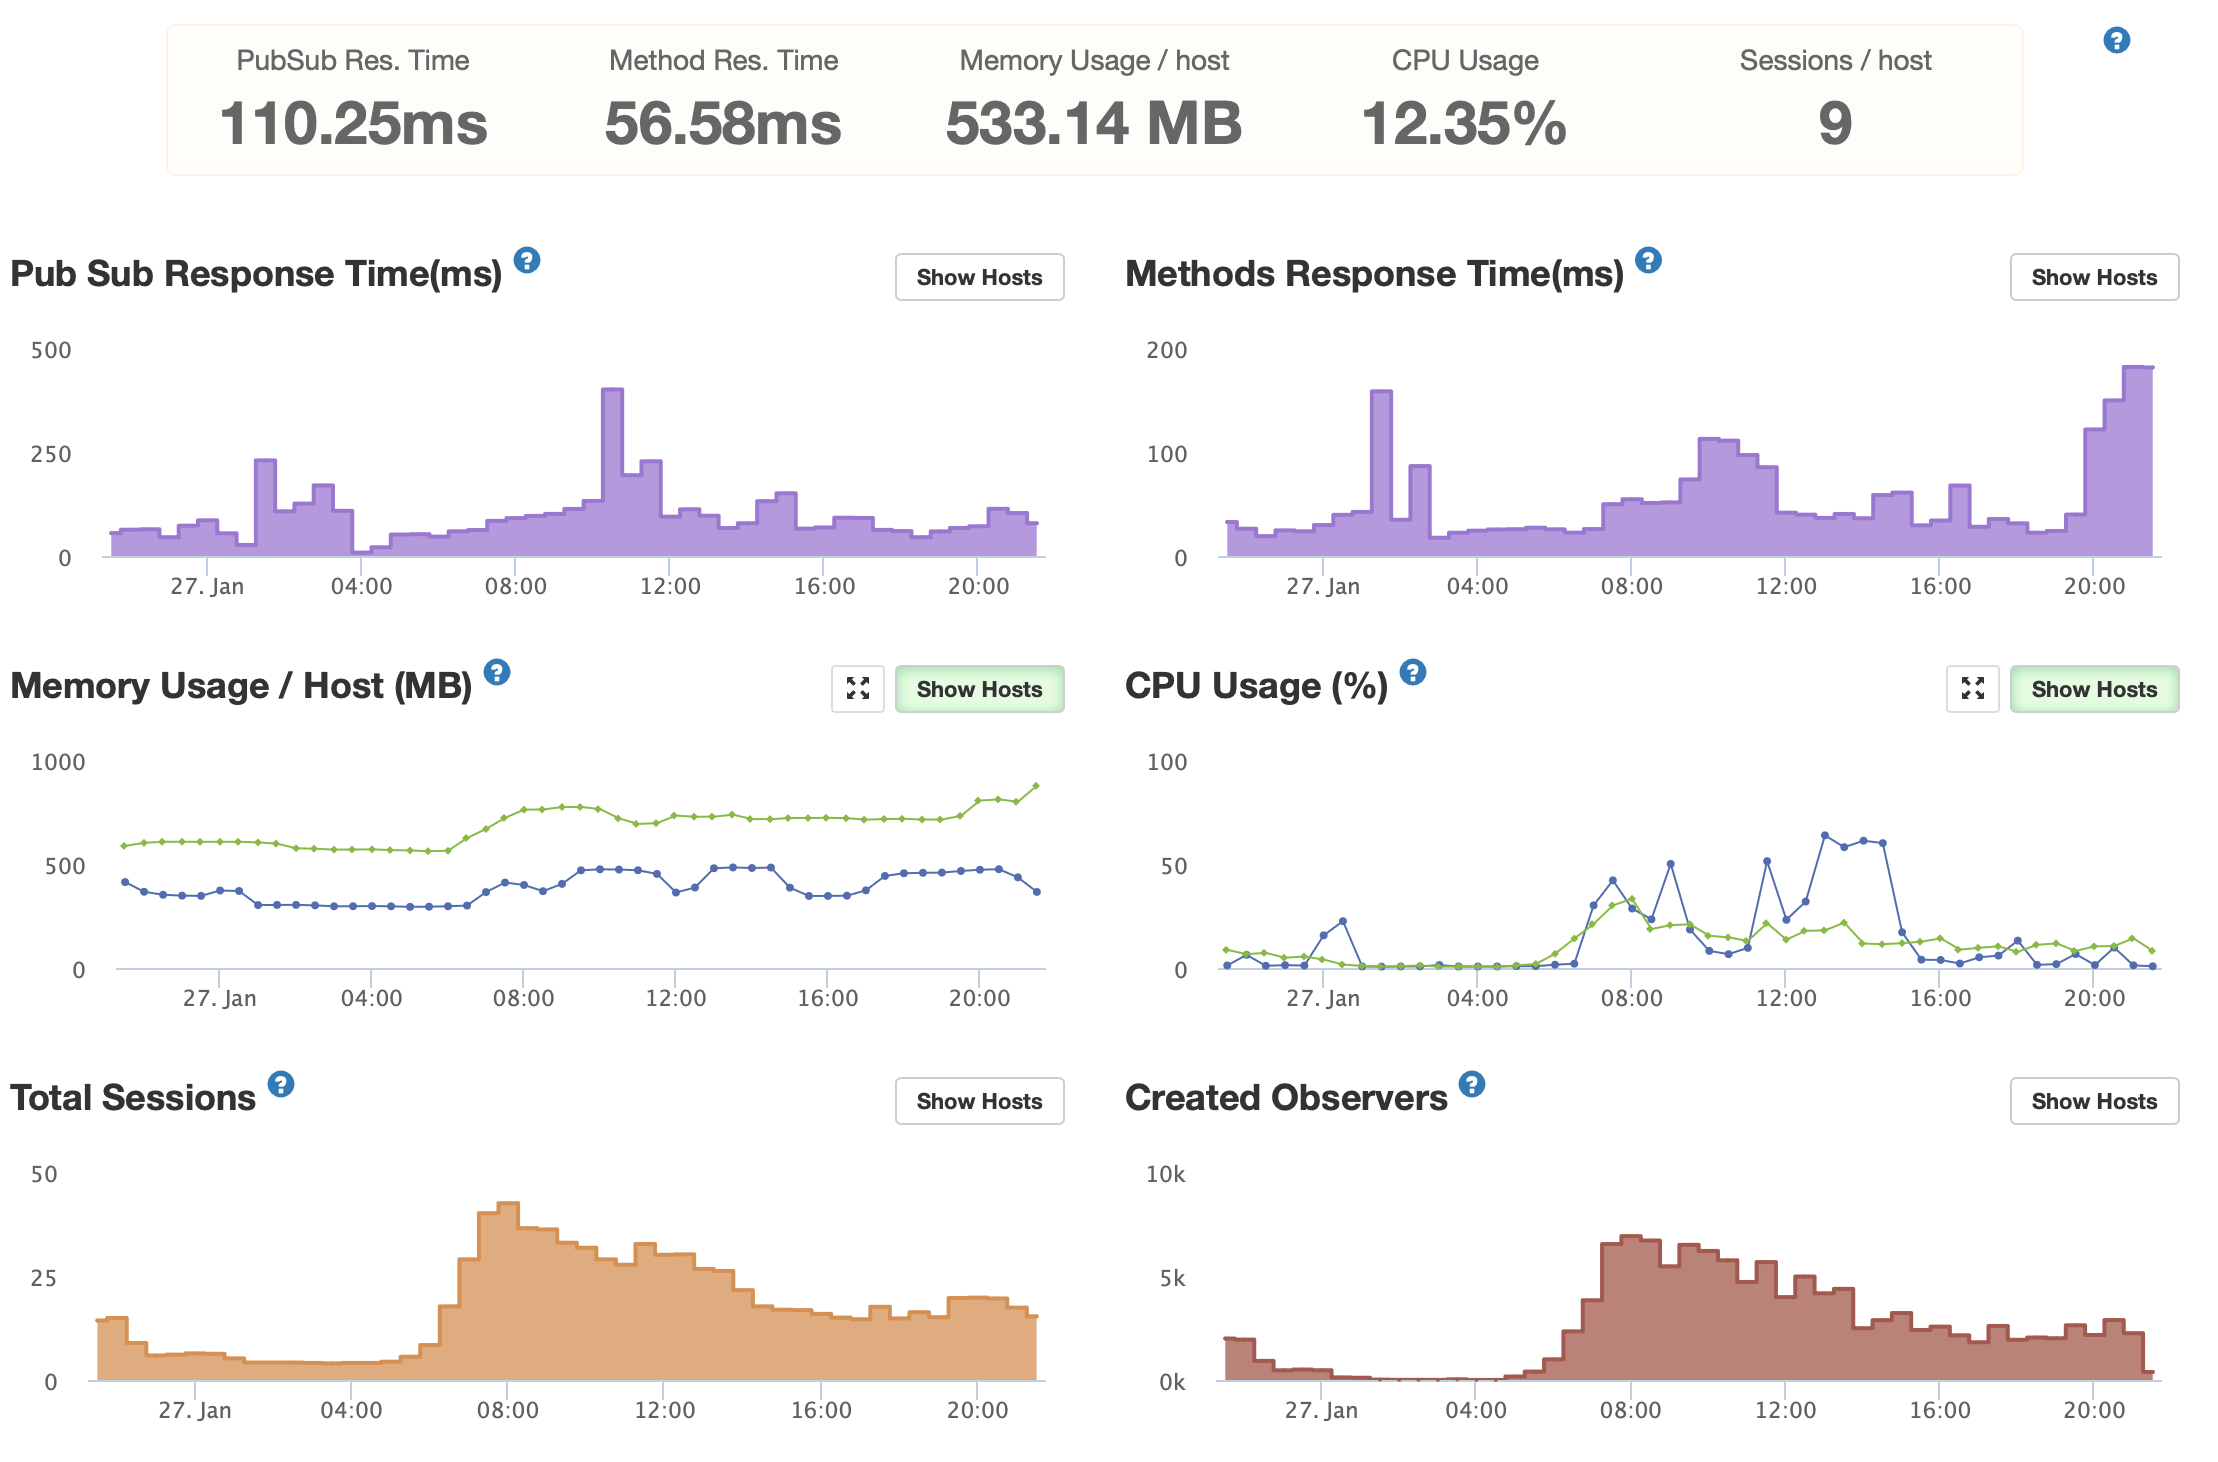
I now have 3.1 up and running and expect a busy day. First impression is that memory usage on web containers is significantly better; I’ll report later how memory got freed after todays usage.
This is my packages file
meteor-base@1.5.2             # Packages every Meteor app needs to have
mobile-experience@1.1.2       # Packages for a great mobile UX
mongo@2.0.3                   # The database Meteor supports right now
reactive-var@1.0.13            # Reactive variable for tracker

standard-minifier-css@1.9.3   # CSS minifier run for production mode
standard-minifier-js@3.0.0    # JS minifier run for production mode
es5-shim@4.8.1                # ECMAScript 5 compatibility for older browsers
ecmascript@0.16.10              # Enable ECMAScript2015+ syntax in app code
typescript@5.6.3              # Enable TypeScript syntax in .ts and .tsx modules
shell-server@0.6.1            # Server-side component of the `meteor shell` command
hot-module-replacement@0.5.4  # Update client in development without reloading the page

static-html@1.4.0             # Define static page content in .html files
react-meteor-data@3.0.1       # React higher-order component for reactively tracking Meteor data
accounts-password@3.0.3
alanning:roles
ostrio:files
session@1.2.2
check@1.4.4
http@3.0.0
mdg:validated-method
email@3.1.1
aldeed:collection2
percolate:migrations
cinn:multitenancy
tracker@1.3.4
meteortesting:mocha@3.2.0
dburles:factory
accounts-2fa@3.0.1
bratelefant:meteor-api-keys
dburles:mongo-collection-instances
leaonline:oauth2-server
accounts-passwordless@3.0.0
matb33:collection-hooks
montiapm:profiler@1.7.0-beta.2
montiapm:agent@3.0.0-beta.10
Roles, multitenancy, oauth2, and files are local packages.
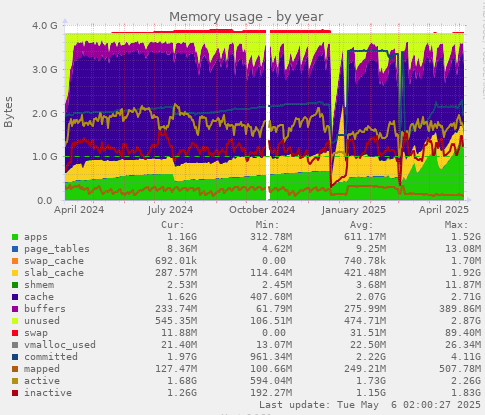
All my production apps on 3.1.1-beta are still seeing constant increase in memory and under the new Meteor version the “idle” CPU is double than what I had under 3.1.
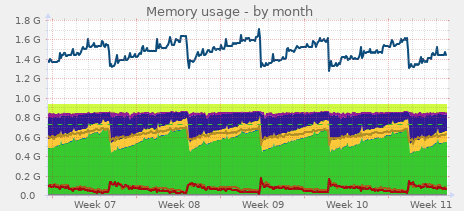
Lower levels of memory are time when I deploy a new bundle. Will leave it now over the weekend to see where it goes.
Quick update since now my service is experiencing some load again from the users after holidays. Updated to 3.1 and memory leaks in production seem to be resolved.
However, if I update to 3.1.1, my mocha tests still fail because memory is running out (even if I set it to 8GB). No issue if I downgrade to 3.1.
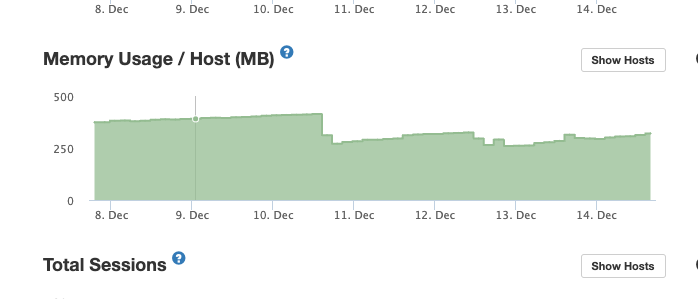
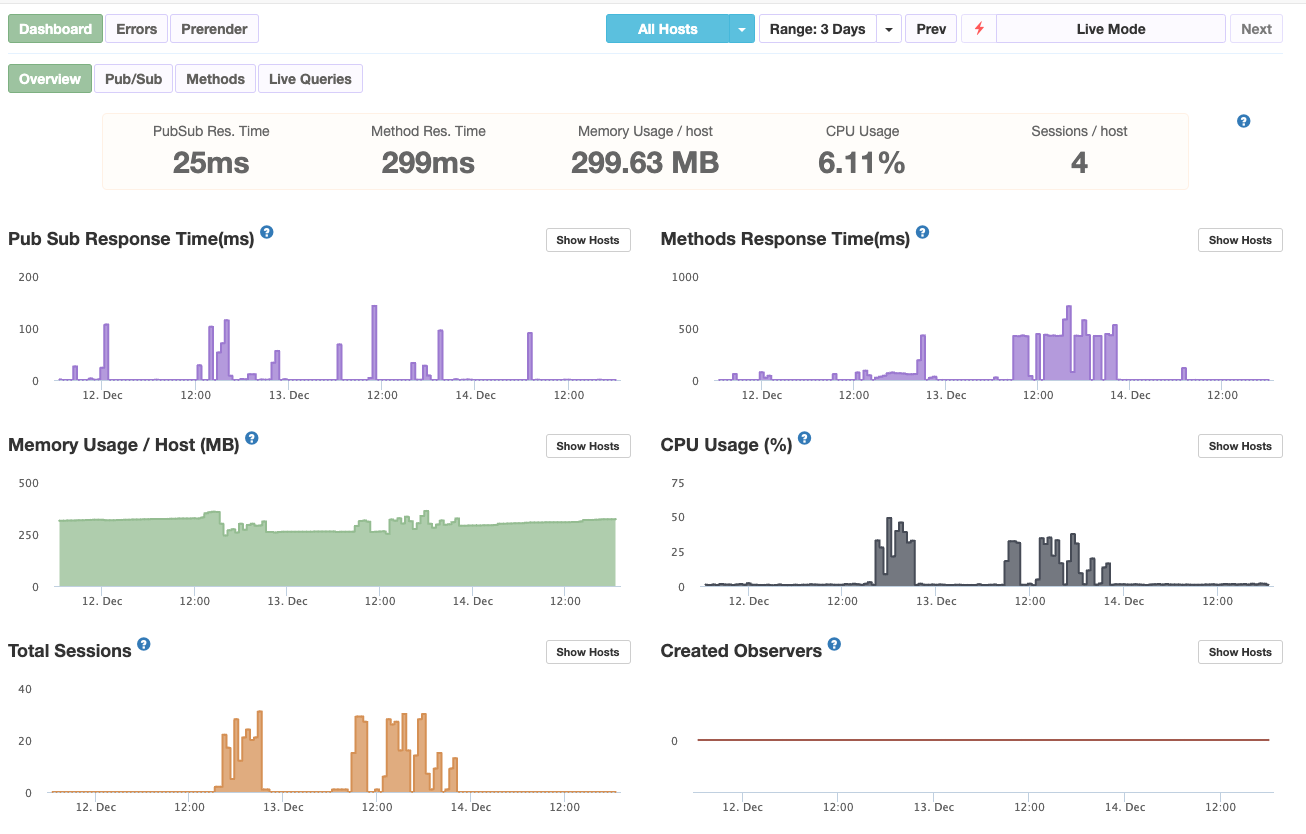
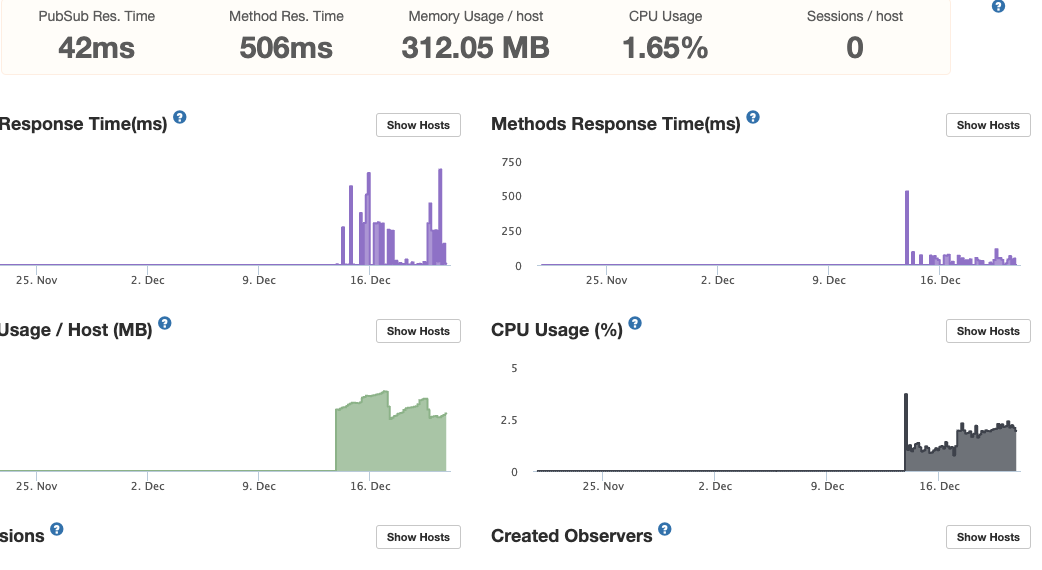
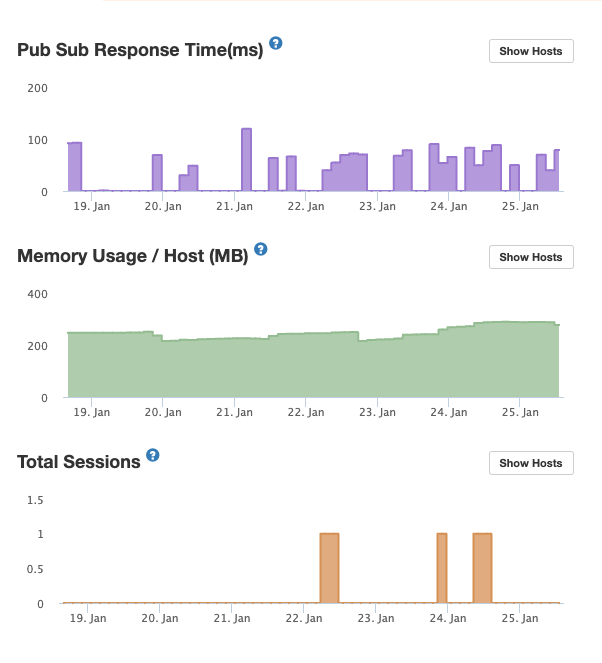
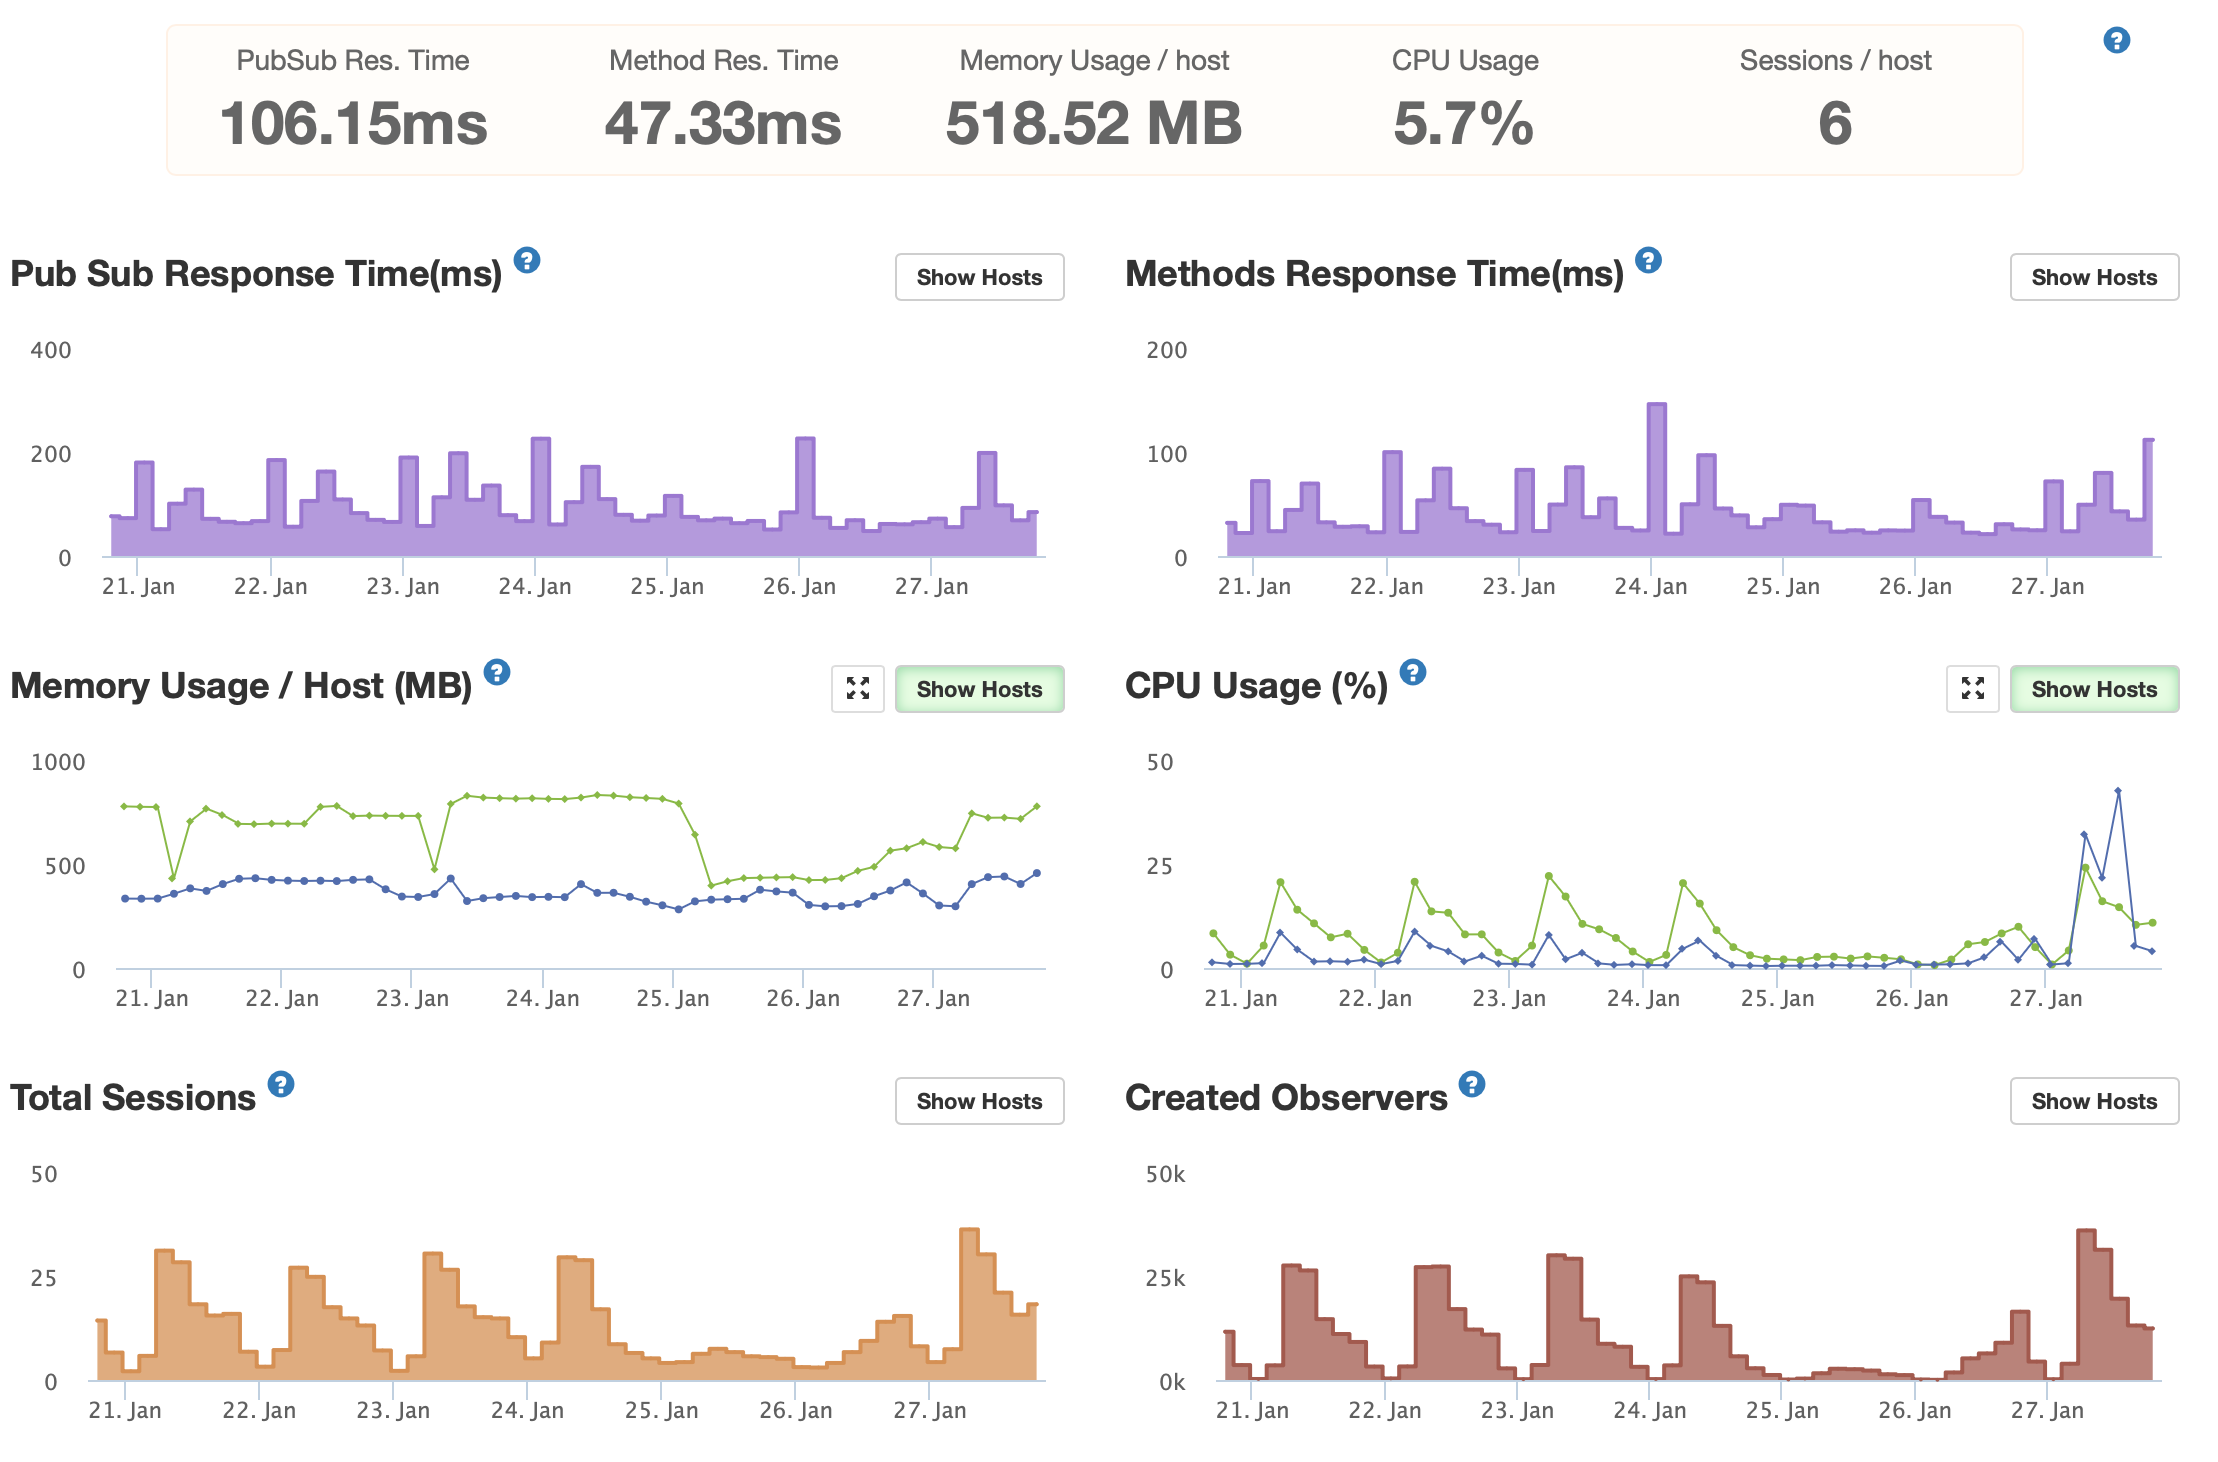
Also wanted to add to screenshots as well, one is last 7 days and one is from today (was quite busy; the blue line in the memory diagram is a queue worker, green one is web). Had deployed on 21. Jan, 23. Jan and 25. Jan.
Same happening here. Self hosing. RAM usage of the mongo service goes up untill mongo crashes and gets restarted automatically. Happens on all our servers that we update to Meteor v3
@1ux: Could you specify which Meteor version you are using? Are you on Meteor 3.2 or an earlier version like 3.0.4? We upgraded the Mongo driver around Meteor 3.1, so it would help to know if the issue also appears in 3.0.4.
Also, could you share the full list of Meteor packages you’re using? This might be caused by a specific package that isn’t optimized, or it could be a side effect related to the core that we need to identify.
Meteor 3.1 definitely upgraded the Mongo driver from 4.x to 6.x, but that change was only in the tooling versions, not any core code drastically changed. Our benchmarks showed higher CPU and RAM usage just by the upgrade, and private app data confirmed the new driver needs more resources for the same work. We would just have to live with more resources in our machine setups. But I believe, as Mongo evolves, we should update how Meteor handles operations and plan improvements to the Mongo API for further optimizations.
For now, could you downgrade to 3.0.4 and check if the issue still occurs?
This will confirm if the driver upgrade caused the issue without any code changes, or if it’s something else in your Meteor 3 migration and the app code. Performance is hard to predict with every package and code combination. I don’t see any packages like redis-oplog or publish-composite using the Mongo API heavily in your case (do you?). This use case seems isolated and shared publicly for further study if confirms the stability in Meteor 3.0.4.
Thx!
We can give updates on this only in about two months, as production will only then being deployed again.
The upgrade itself was done without many other changes in the code I guess. If you wana investigate further, feel free to deploy different versions of our repo yourself and check it there.