Did you check slow query logs on MongoDB to see if you miss some indexes?
Or checkout out redis-oplog?
1 Like
This looks like a classic missing index. Find all the colscans happening in
your db. How big are the collections?
I’m confident it’s not my indexes. I’ve went over them several times. All my Meteor methods are running super fast. So my objects are being queried fast via Meteor methods.
I removed service-configuration from my app for now, going to see if that helps and/or throws the delay onto something else.
I’ll be testing out redis-oplog in another month or two, however my delays are both being caused by Meteor packages… not really my own objects/subscriptions.
Are you using compose?
If so, ask them to turn on logging for slow queries.
That should reveal a lot, including whether or not those queries were using index.
I had one AHA-moment when I realised that even though my indexes were set, merely querying in the wrong sort order caused index misses. There are a lot of gotchas in the world of Mongo!
Hi. I just did a LOT of research with Kadira and Mongo optimization.
Have a look at my post here, maybe it’s of use to you.
You’re running Mongo with OpLog enabled in a minimum 3 cluster instance, yes?
Still using redis-oplog and grapher.
Optimizing queries really saves nerves, not to mention reactive collections are overkill quite often, grapher a lows for easy switching them into methods.
So I had another 150 or so users hit my server again.
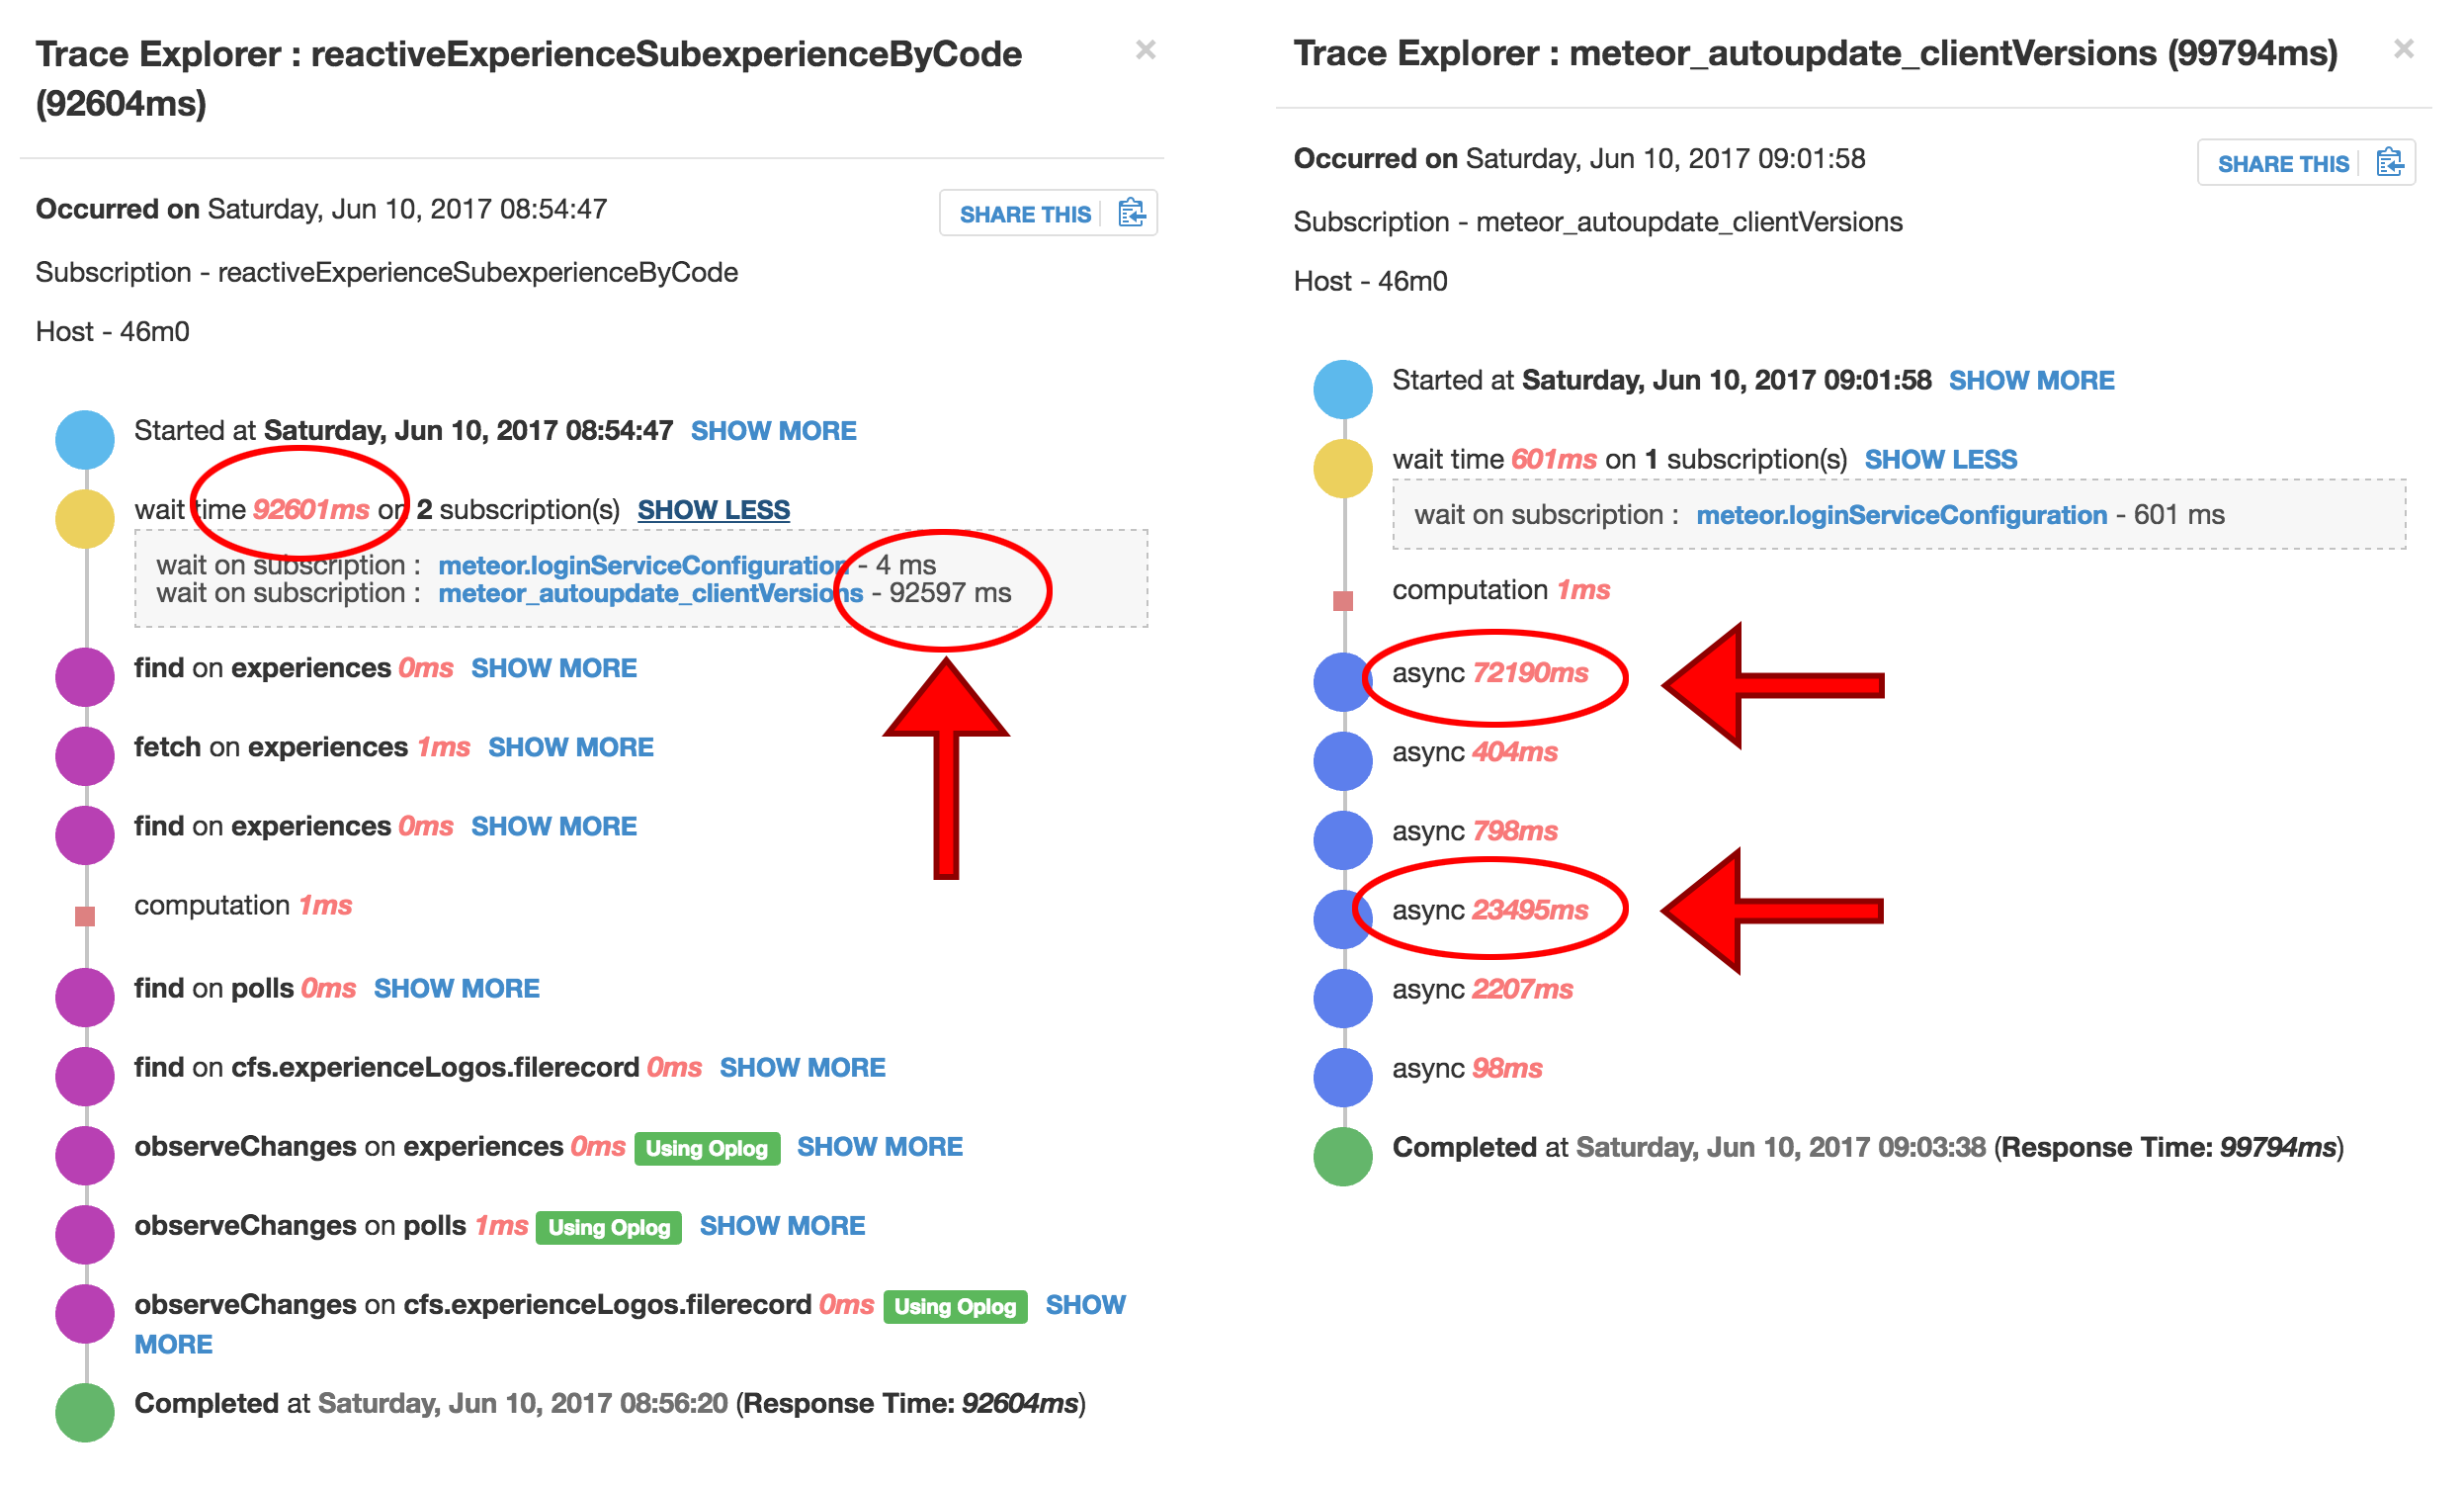
I had removed service-configuration from my app. And as I predicted, the long wait times have shifted over to meteor_autoupdate_clientVersions. See the below stack traces where I’m seeing 92,601 ms wait times. The good news is on the stack trace specifically for meteor_autoupdate_clientVersions all the wait time is located in one or two of the async calls. I tried Googling about this but I’m not finding much. Does this have something to do with not calling this.unblock() correctly? Or something along those lines of Meteor/Node blocking for some reason? I could very well be doing something wrong here. I’ve experimented with these calls before but didn’t notice much difference.
@XTA @elie @nadeemjq I had help from compose.io about turning on slow query logging back in March and I had it enabled during this incident. The good news is I barely have any slow queries logged - 19 total actually. Most are from April where I did actually have a missing index issue. The last few were in early June a few days before this incident but they’re unrelated. ALL of my slow queries were less than about 150ms, so they’re not the issue. This slowness is not a database issue.
EDIT: I guess this is no longer a “Mongo Scaling Issue” per the thread. Though I still haven’t solved what the actual issue is.
@SkyRooms Yes I’m running Mongo with OpLog enabled. Sometimes I run a single node, sometimes I run two. Was doing some experimenting. For these latest benchmarks I’m running two.
Well firstly I’d open up a new thread about it. Might get more responses to
the specific issue at hand.
Re-read the post. I see what you’re saying, login services takes forever to respond.
If it were me, I’d try meteor create version2 and import all my stuff. See if that helps with fresh packages.
I know after a while you end up with more crap thrown in a project than you realize. Start with a fresh cup of coffee and fresh project. See if that helps.
#Debugging…
I’m still wondering if this issue in this thread https://github.com/meteor/meteor/issues/4559 is my problem. This is strange because my app doesn’t even require the user to login. I don’t have any of the accounts packages added.
EDIT: Looks like I am using accounts-base@1.2.2 Going to look into removing this and see if my app still works as I’m not explicitly using any of the other accounts packages.
Interesting. I’ve also seen methods waiting on login a lot, but it was
usually part of a bigger issue somewhere else where the entire database was
being held up by a missing index.
BTW, why don’t you just update the entire app to 1.5? What’s holding you
back?
TL;DR: OPLOG and/or Meteor poll and diff is the issue. Will integrate redis-oplog in three weeks.
After a lot of thread-reading and Kadira metrics analysis, I think I figured out what the issue is… it’s the classic circa-2015 “OPLOG clogging everything up after about thirty users issue”. And if by any chance it’s not the OPLOG, then it’s the Meteor poll and diff that’s getting me. Sadly, it’s taken me forever to realize I’m having a problem with something that was really well known for the last two years.
I finally found some really helpful threads and realized my app was doing “high velocity” writes. All my users send an update at almost the exact same time, what’s more, they’re all updating the same document. I found a post by MDG about how Meteor 1.3 has some new tools for disabling the OPLOG and how a large number of writes on the same object can create a hotspot without maxing out the CPU which was a phenomenon I was seeing. The following pages were really helpful:
OPLOG: A TAIL OF WONDER AND WOE (Very similar to my use-case)
Meteor OPLOG flooding (Great forum thread)
Tuning Meteor Mongo Livedata for Scalability
My experience hitting limits on Meteor performance (Also similar to my use-case)
I did a “deep dive” into my Meteor APM (Kadira) data for this latest server slowness and I started noticing a lot of funny things. I found stack traces where meteor_autoupdate_clientVersions was doing a bunch of observeChanges that were really slow. A lot of observeChanges in my app were fine with only a few users but once more than twenty or thirty logged in, the same observeChanges slow to a crawl.
The issue with meteor_autoupdate_clientVersions and meteor.loginServiceConfiguration having long wait times is indeed as I suspected merely a side-effect. If I understand correctly, both of those calls are synchronous on each client… they don’t use this.unblock(). So if my app is loaded up with 150 users and the OPLOG is clogged to all hell and back, those new users who log in get stuck waiting on meteor_autoupdate_clientVersions and meteor.loginServiceConfiguration which is in alignment with what my users were seeing in the app. And there’s always new users logging into my app because my app is very bursty - i.e. it goes from 5 users to 150 or more in about a minute.
Another huge gotcha I discovered is my admin app was actually creating/getting a ton of OPLOG traffic from my non-reactive mobile-client app. My app is actually two apps. An admin app and an end-user mobile-client app, both connecting to the same database. In the mobile-client app, I flame-thrower’d all the reactivity out of it (per my input above) and didn’t understand why the OPLOG was still killing me… well, I didn’t remove any reactivity out of the admin app because there’s only ever maybe five users at any time using the admin app. However, if my assumptions are correct, those five users on the admin app are all processing the reactivity of my 150 mobile-client users. So all those interactions all happening at the exact same time on the exact same object are being multiplied by however many admin users I have. And also still a little bit on my mobile-client app because I had to leave a little bit of reactivity in it. So this was something I didn’t consider… that Meteor was still having to process the OPLOG for my admin app users.
Another weird little gotcha is MongoDB shows no slow queries. Which can’t be true because Meteor APM (Kadira) is showing me all kinds of find() and fetch() calls (i.e. a Meteor findOne()) that are taking 3000+ ms. I checked my slow queries on my PRIMARY mongo node and it showed only about 19 slow queries, each no more than 200 ms, all from several months ago… weird. I checked my SECONDARY mongo node which is what enables OPLOG and the slow queries was empty. BUT, the compose.io help team told me this table can occasionally reset itself when a resync is performed. So there’s a very good chance I’m likely not seeing my OPLOG slow queries being reported. Not sure how often a resync happens between the nodes… seems fairly often as I checked the SECONDARY for slow queries a few days after this latest case.
So now, I’m going to build some diagnostic testing tools to simulate all those users so I can create this storm of activity at any time on my own. Then I’m going to disable the OPLOG and see if I still have this issues without it. If so, then I’ll have to figure out what to do about that. If not, I’ll very likely try to start integrating redis-oplog which makes me very happy because I removed a lot of cool interactivity trying to solve these issues. It would be great to get it back. My only other option is to try some of the Meteor 1.3 disableOplog options on publications (I’m still on Meteor 1.2.1). I’m sure those would do the trick, but then again, I’m losing some responsiveness. In about three weeks I’m going to jump on this full-time and will report back my findings and results.
So this still could very well be a “Mongo Scaling Issue”… more to do with the OPLOG, but still Mongo involved also.
@elie I haven’t upgraded yet because this is for a production app. In the past, whenever I upgrade I always have a package or two that breaks. That was when I was upgrading right away, so now I’ll probably be okay. But again, with a production app, you have to have the time to test and work out any issues, which at the moment I’m short on. I’ll upgrade to 1.5 hopefully in about three weeks.
4 Likes
You should search the forum here, I did an EXTENSIVE test of Oplog for my MMO game.
Oplog is a REQUIRED Meteor methodology. At least it should be. There should be warnings in a billion places while putting it on production.
Very short sited by Meteor, but they’ll probably have a Galaxy based solution in the future.
1 Like
Yeah I kinda did search the forum… a lot. That was the point in linking all those threads.
What did you use for testing OPLOG? How did you simulate users?
Just because Kadira is showing you a slow query doesn’t mean it’s happening on the mongodb end. From the graphs above you’ve only shown long wait times. I haven’t seen a slow response from the database which you can view in kadira.
And I don’t know what you’re expecting to see on the secondary node. You said yourself that no slow queries have been reported for months. So it could have been reset months ago. Not days ago. But this makes it sound like there’s some misunderstanding around what’s happening with oplog.
The problems with oplog are on the meteor end. That your app has to process a long list of operations coming in from mongodb. If you’re doing observes and have to check each item coming in then that can eat all your cpu if you’re observing a lot of data. Publications will also be observing data.
I’m on mobile and haven’t reread the whole thread over. But are you horizontal scaling? 150 users per instance is the upper limit. I’d try running three instances and seeing what happens.
And upgrade from 1.2. Open a new git branch and try it and check if all works smoothly locally. Push it to the admin side first if you’d like. Then try production. Not sure what the worst that can happen is. Sounds like people are having problems as is anyway.
1 Like
You mean like this:
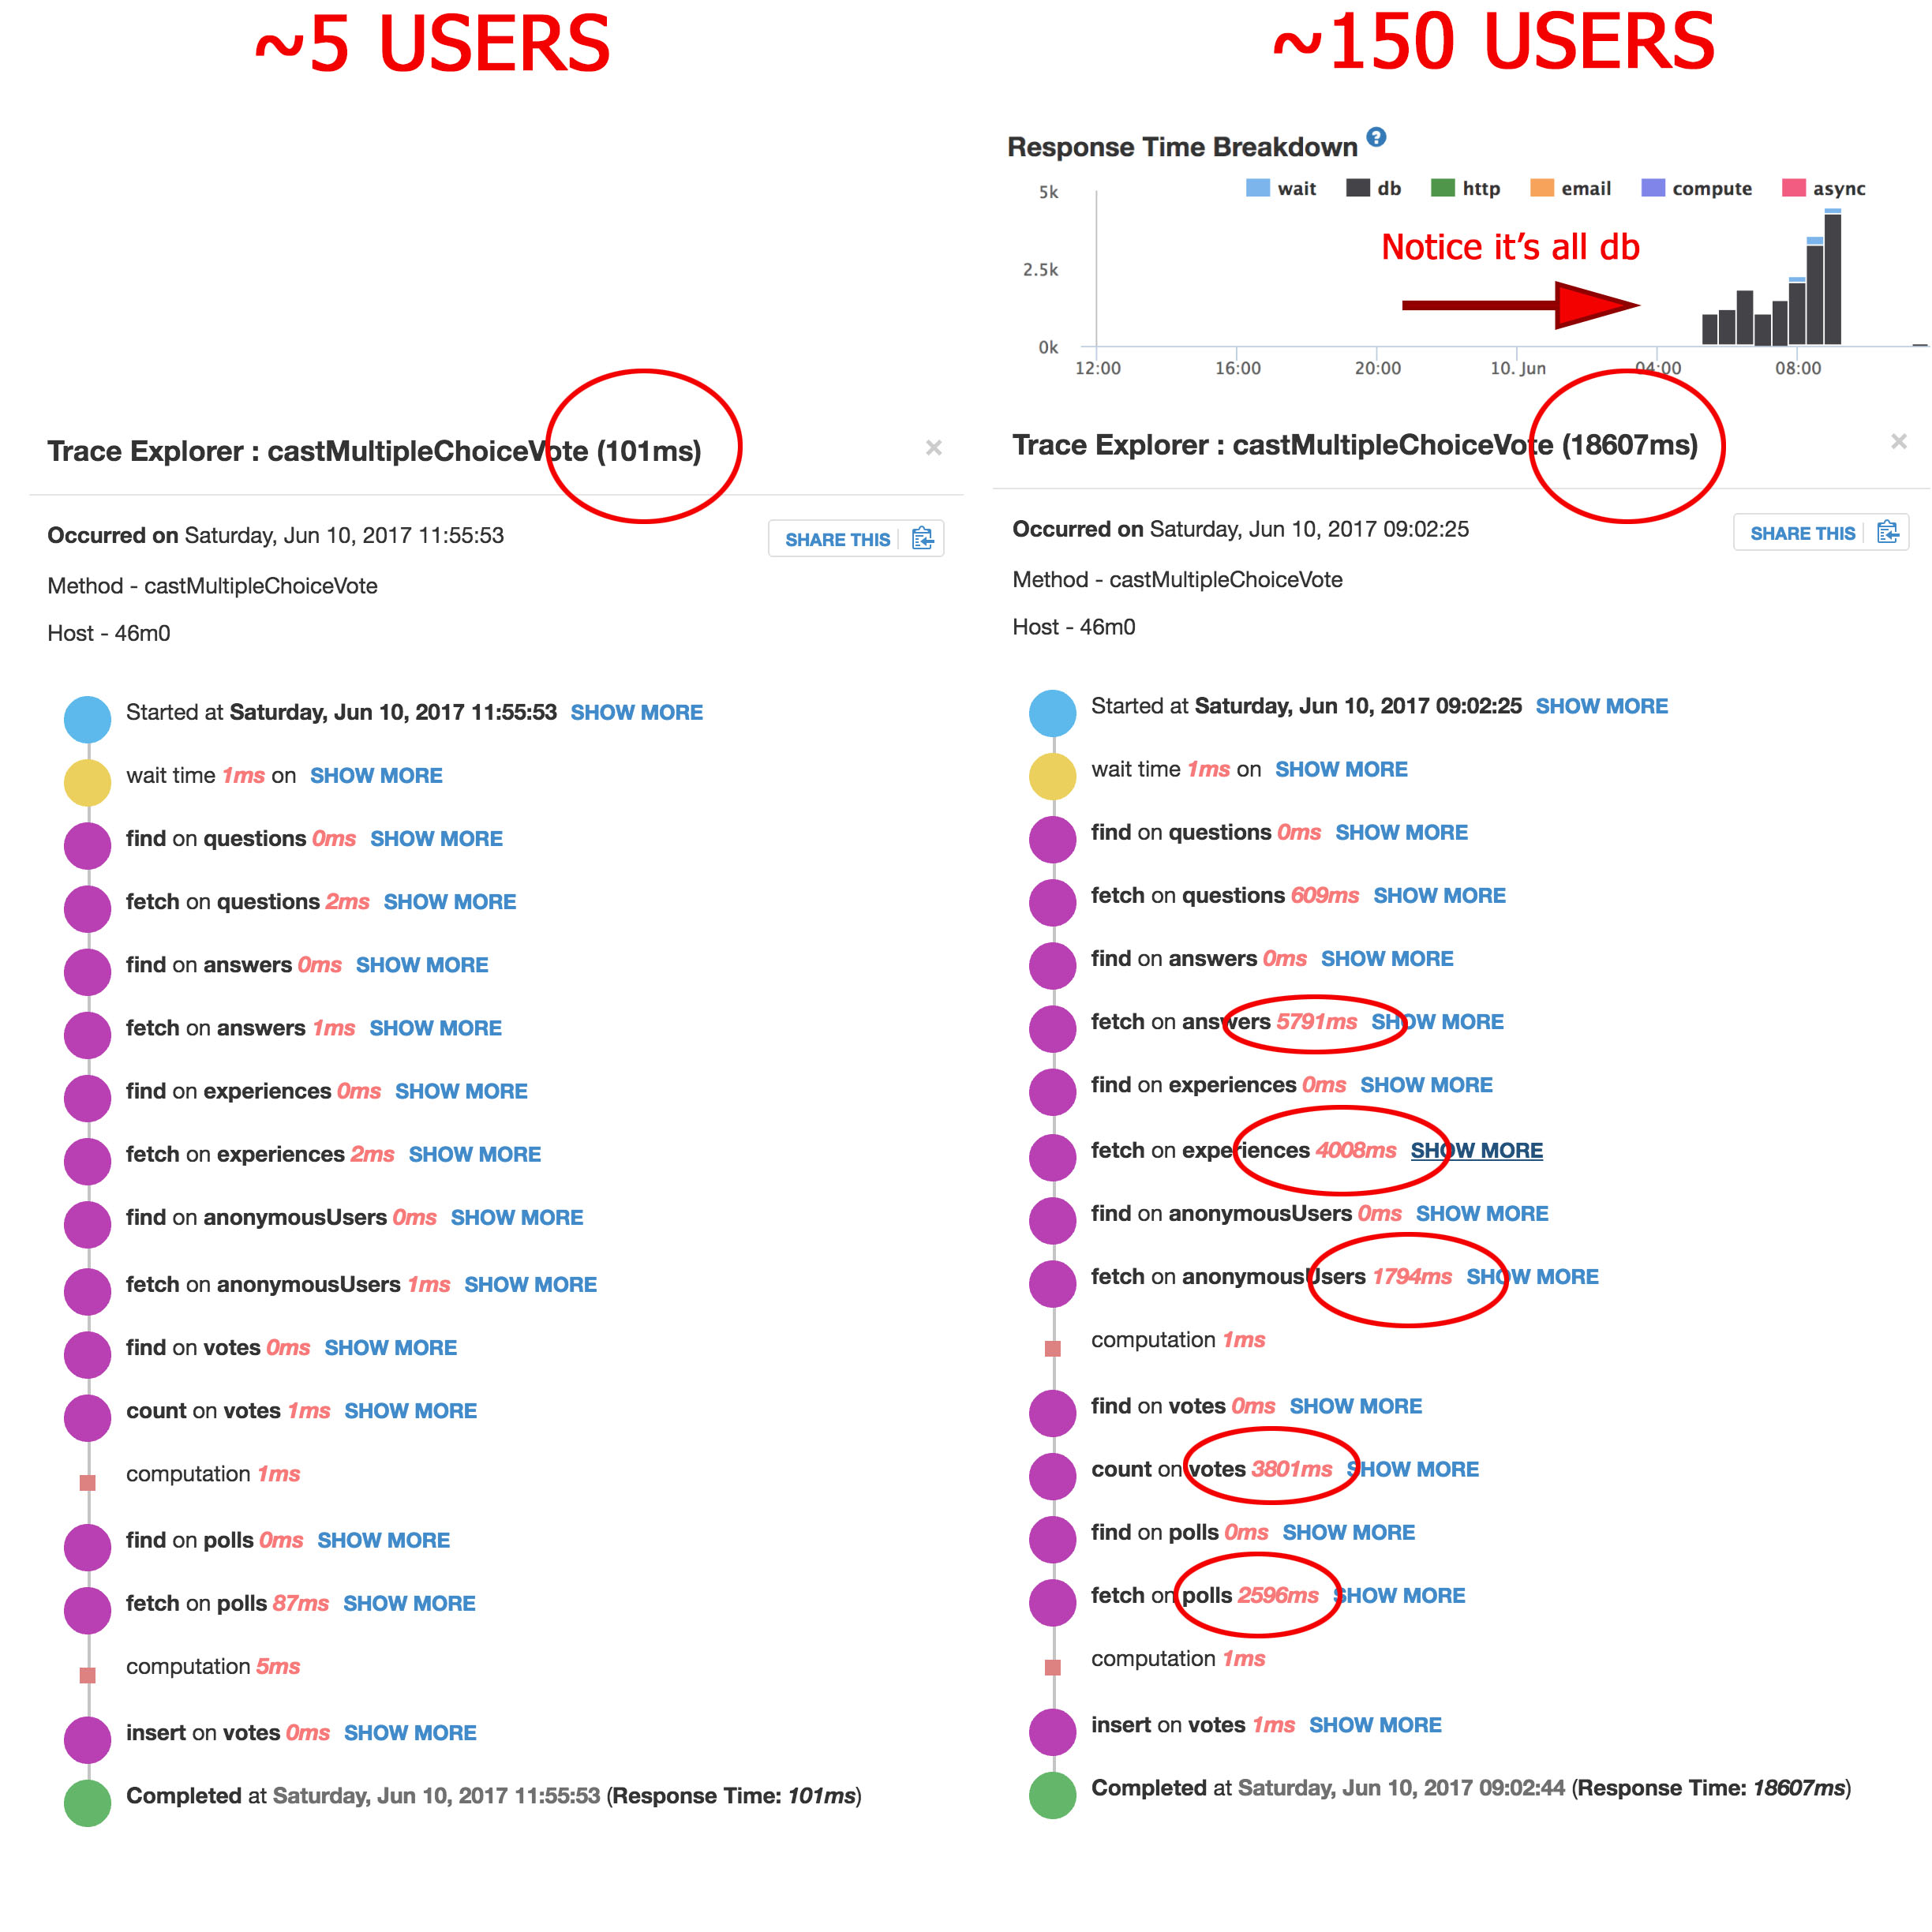
This is one of my Meteor methods that bogs down with a lot of users, but is fine with only a few. So shouldn’t this be showing up as slow queries in MongoDB?
The latest slow incident that happened was on June 10th. What I was saying was that the PRIMARY showed no new slow queries. The SECONDARY was empty for slow queries. So maybe it had been reset in the day or so after June 10th incident. So hence, no slow queries to see from the June 10th incident. I’m probably confused (I’m just an average programmer trying to make a framework work with more than thirty users ![]() ), but if the slow queries above were caused by the OPLOG, wouldn’t they be in the
), but if the slow queries above were caused by the OPLOG, wouldn’t they be in the SECONDARY table of slow queries? Doesn’t the SECONDARY feed Meteor’s OPLOG tailing?
Okay, I wasn’t sure where exactly the OPLOG problems would manifest. If it’s my app and the CPU that are bogging down, would that cause the above methods to be so slow… with the long MongoDB query times? The way I understood it was that adding OPLOG adds a lot of extra queries to Mongo which would slow down my methods (and every other part of the app involving Mongo). Especially because I’m not querying by _id in some cases which adds extra queries (I unfortunately can’t in some cases) and we’re talking about hundreds of updates from hundreds of users… are you sure adding OPLOG doesn’t add any overhead on Mongo?
As for horizontal scaling, I have two small Galaxy nodes processing the 150 mobile-client users and one small Galaxy node for the 5 or so admin users. I was trying to keep this down to test, as the mobile-client is really simple. The only thing that makes it complex is that it’s a lot of bursty users and they all send updates to the same document as the exact same time. But there’s very little Pub/Sub reactivity.
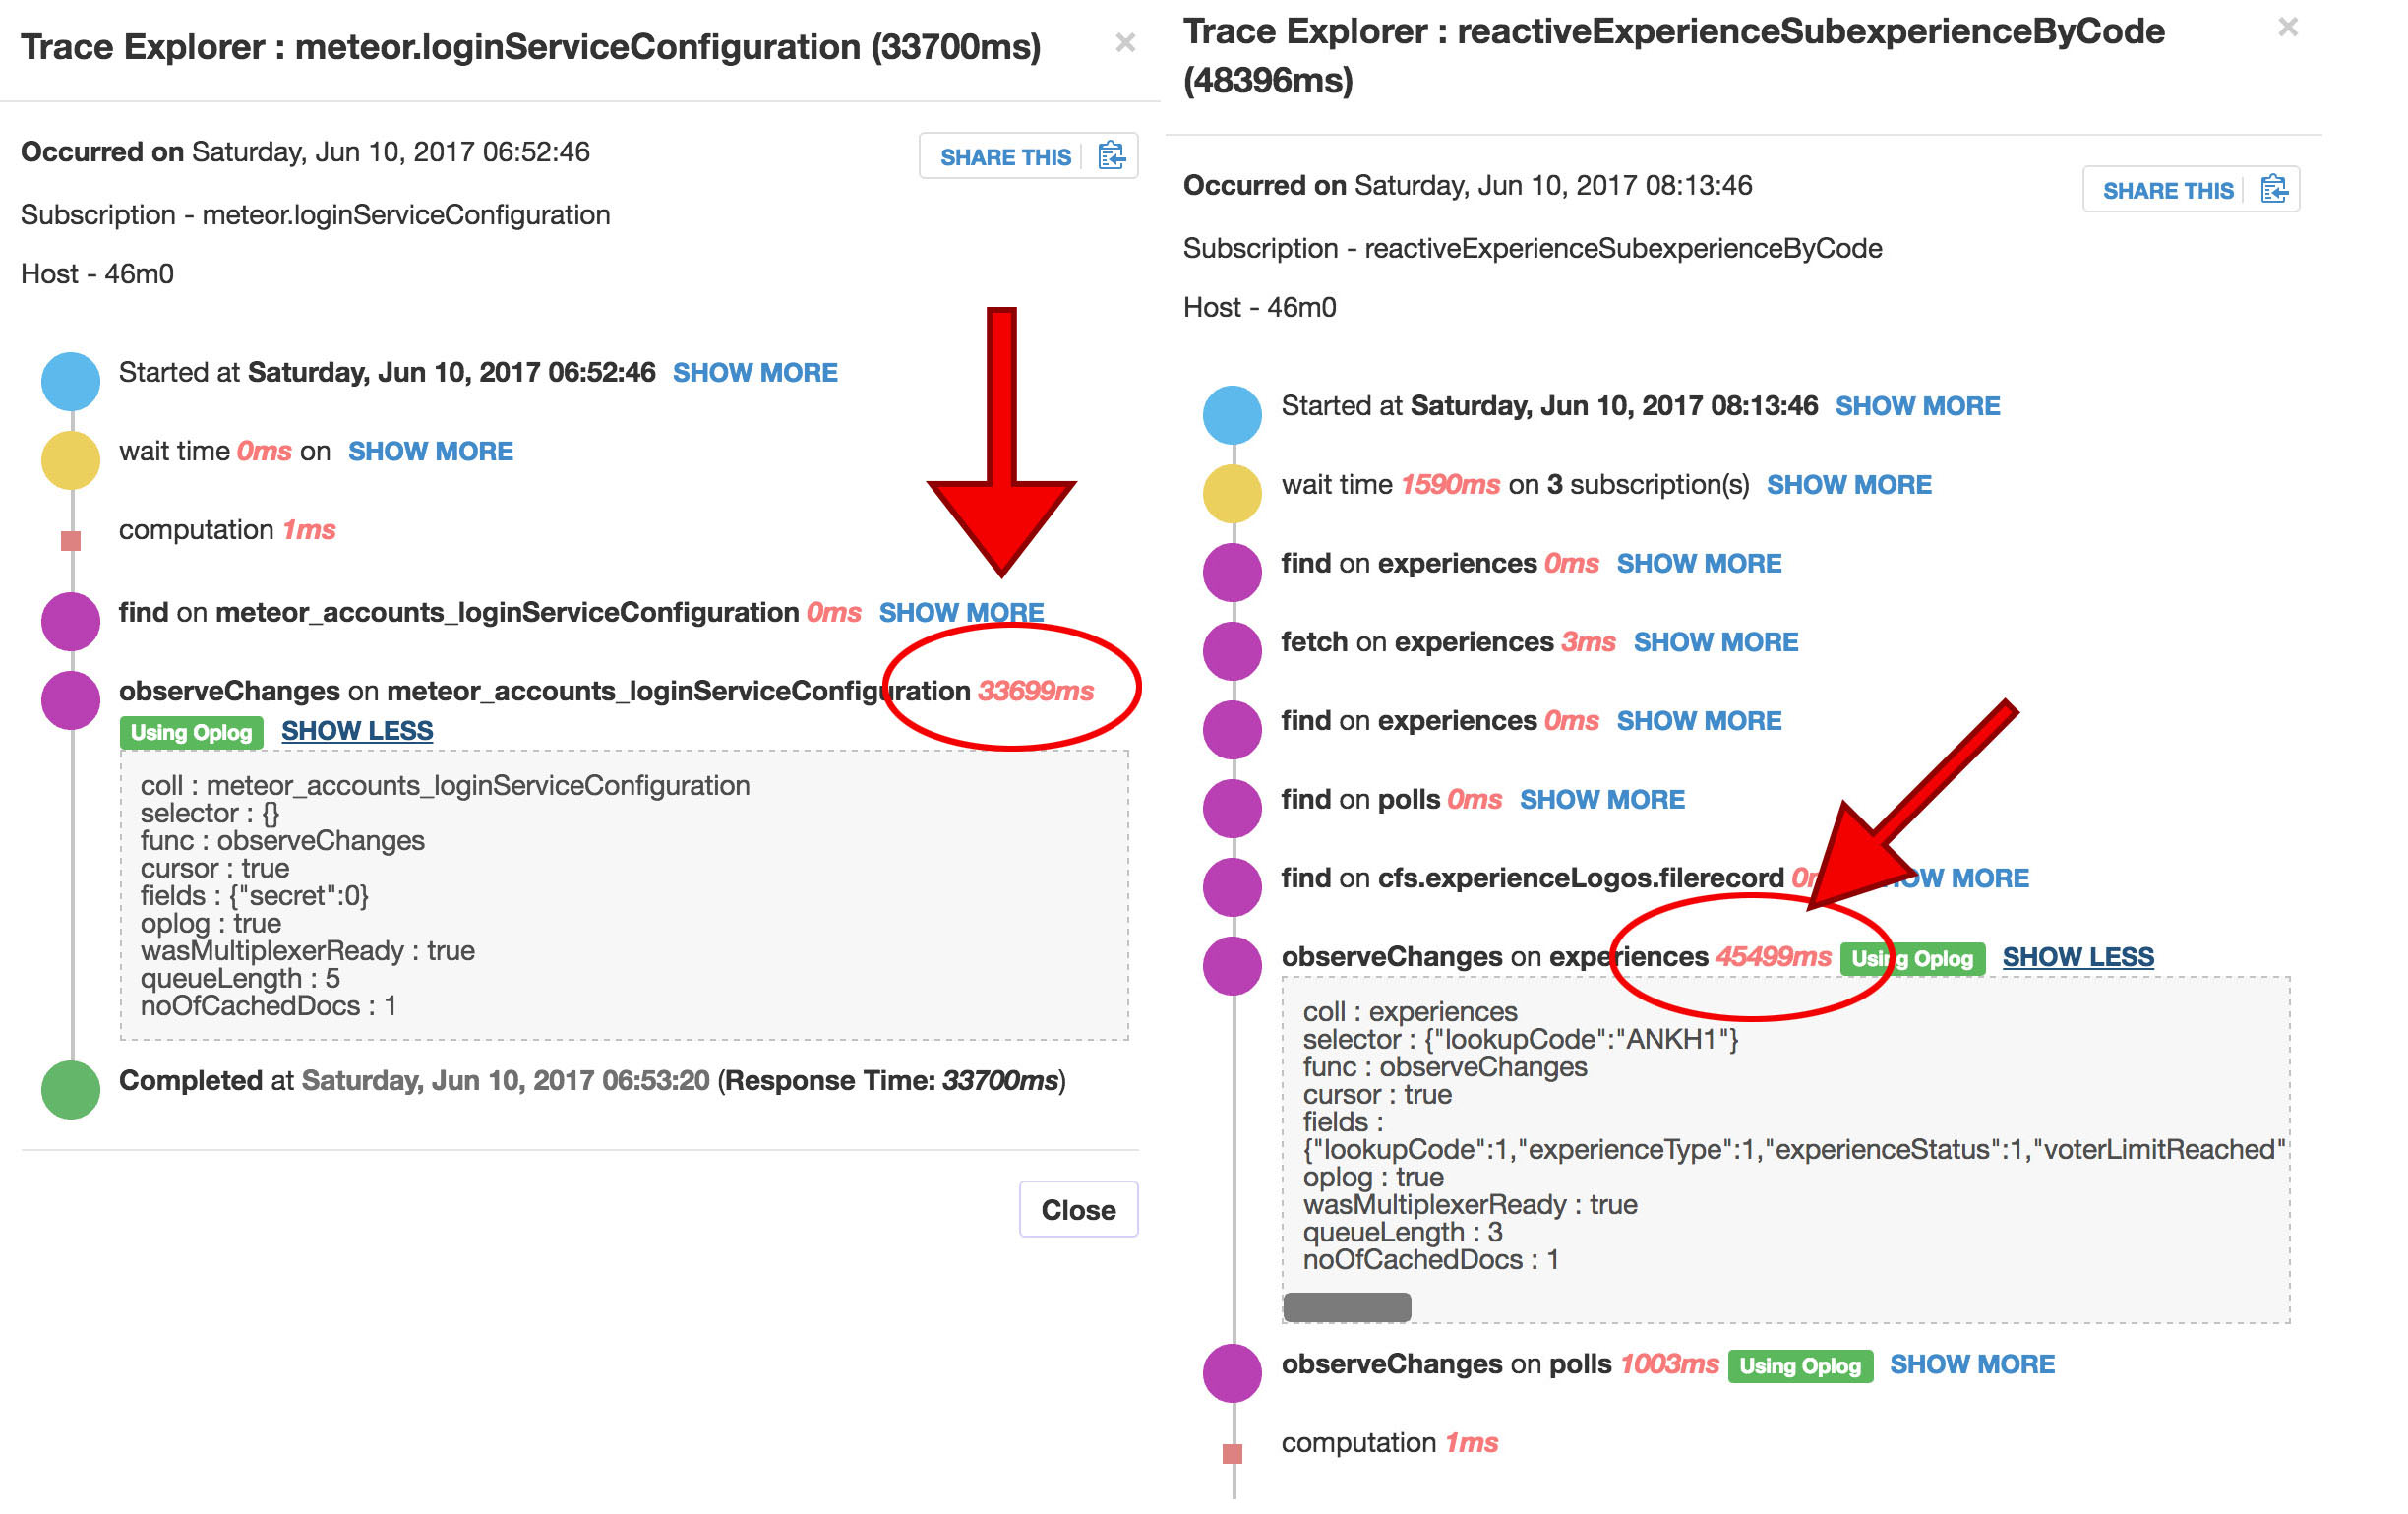
Here’s two Pub/Sub stack traces showing really slow observeChanges times on OPLOG queries… this is direct evidence of OPLOG being the problem no?
And yes, will upgrade very soon.
What happens if you click show more in Kadira for the slow db operations you have?
Can you copy and paste the indexes you’re using as well please. Also, how big many documents does your biggest collection have?
Also, with regards to your index question above, you need compound indexes as explained here:
https://docs.mongodb.com/manual/core/index-compound/
Here’s the same Meteor method call as above with “show more” clicked. FYI, I had emailed the compose.io support team in the past and asked for them to review if I had any COLLSCANS and they said they reviewed the logs and found none.
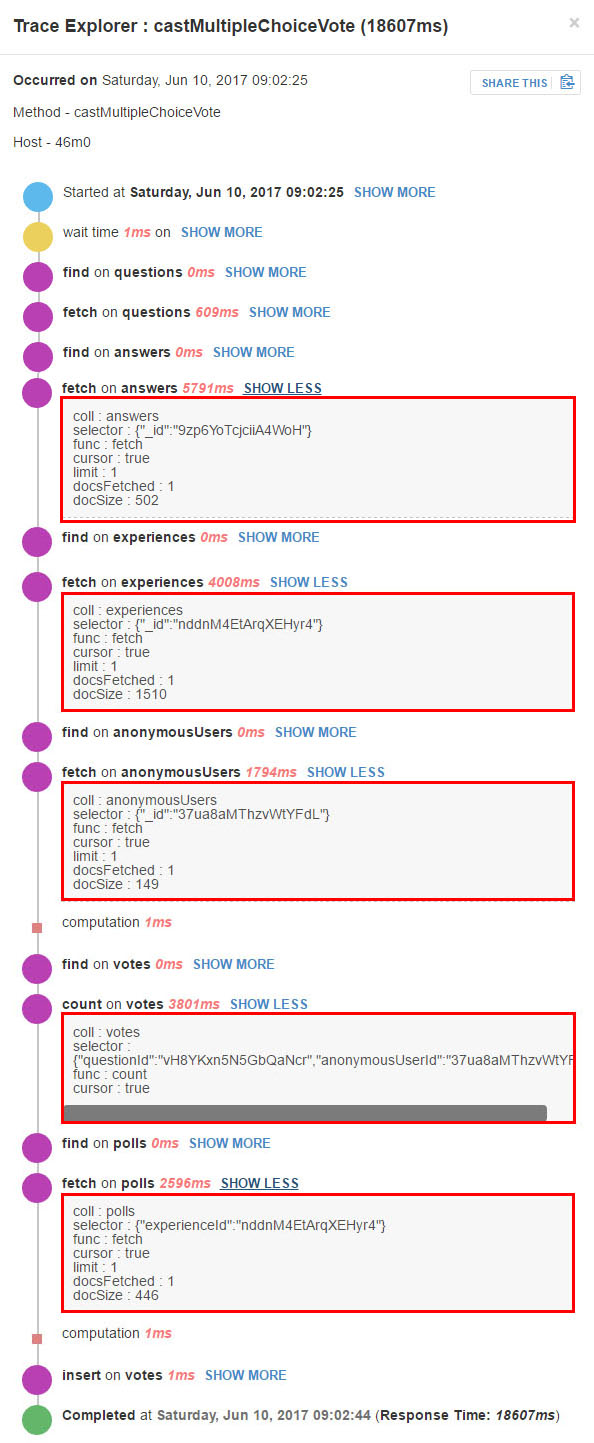
My largest collections that I query actively have document sizes like: 55093, 15221, 23337, 5316, 2077, and then smaller.
I’m 100% sure I have all my indexes covered, I have a lot of them (unless I’m doing something wrong with compound indexes). If it were my indexes that were the problem, wouldn’t my queries with only a few users be slow as well? Here’s a few of my indexes that I added in relation to the above stack trace. I’ve added no new indexes if I only query by _id:
Answers._ensureIndex({experienceId: 1});
Answers._ensureIndex({questionId: 1});
Answers._ensureIndex({userId: 1});
Answers._ensureIndex({userId: 1, experienceId: 1});
Answers._ensureIndex({userId: 1, experienceId: 1, anonymousUserId: 1});

Experiences._ensureIndex({lookupCode: 1}, {unique: 1});
Experiences._ensureIndex({userId: 1});

Votes._ensureIndex({userId: 1});
Votes._ensureIndex({experienceId: 1});
Votes._ensureIndex({questionId: 1});
Votes._ensureIndex({answerId: 1});
Votes._ensureIndex({anonymousUserId: 1});
Votes._ensureIndex({userId: 1, experienceId: 1});
Votes._ensureIndex({anonymousUserId: 1, experienceId: 1});
Votes._ensureIndex({userId: 1, experienceId: 1, anonymousUserId: 1});

Polls._ensureIndex({experienceId: 1});
Is too many indexes a problem? I’ve added one for each way I query each collection.