Just because Kadira is showing you a slow query doesn’t mean it’s happening on the mongodb end. From the graphs above you’ve only shown long wait times. I haven’t seen a slow response from the database which you can view in kadira.
And I don’t know what you’re expecting to see on the secondary node. You said yourself that no slow queries have been reported for months. So it could have been reset months ago. Not days ago. But this makes it sound like there’s some misunderstanding around what’s happening with oplog.
The problems with oplog are on the meteor end. That your app has to process a long list of operations coming in from mongodb. If you’re doing observes and have to check each item coming in then that can eat all your cpu if you’re observing a lot of data. Publications will also be observing data.
I’m on mobile and haven’t reread the whole thread over. But are you horizontal scaling? 150 users per instance is the upper limit. I’d try running three instances and seeing what happens.
And upgrade from 1.2. Open a new git branch and try it and check if all works smoothly locally. Push it to the admin side first if you’d like. Then try production. Not sure what the worst that can happen is. Sounds like people are having problems as is anyway.
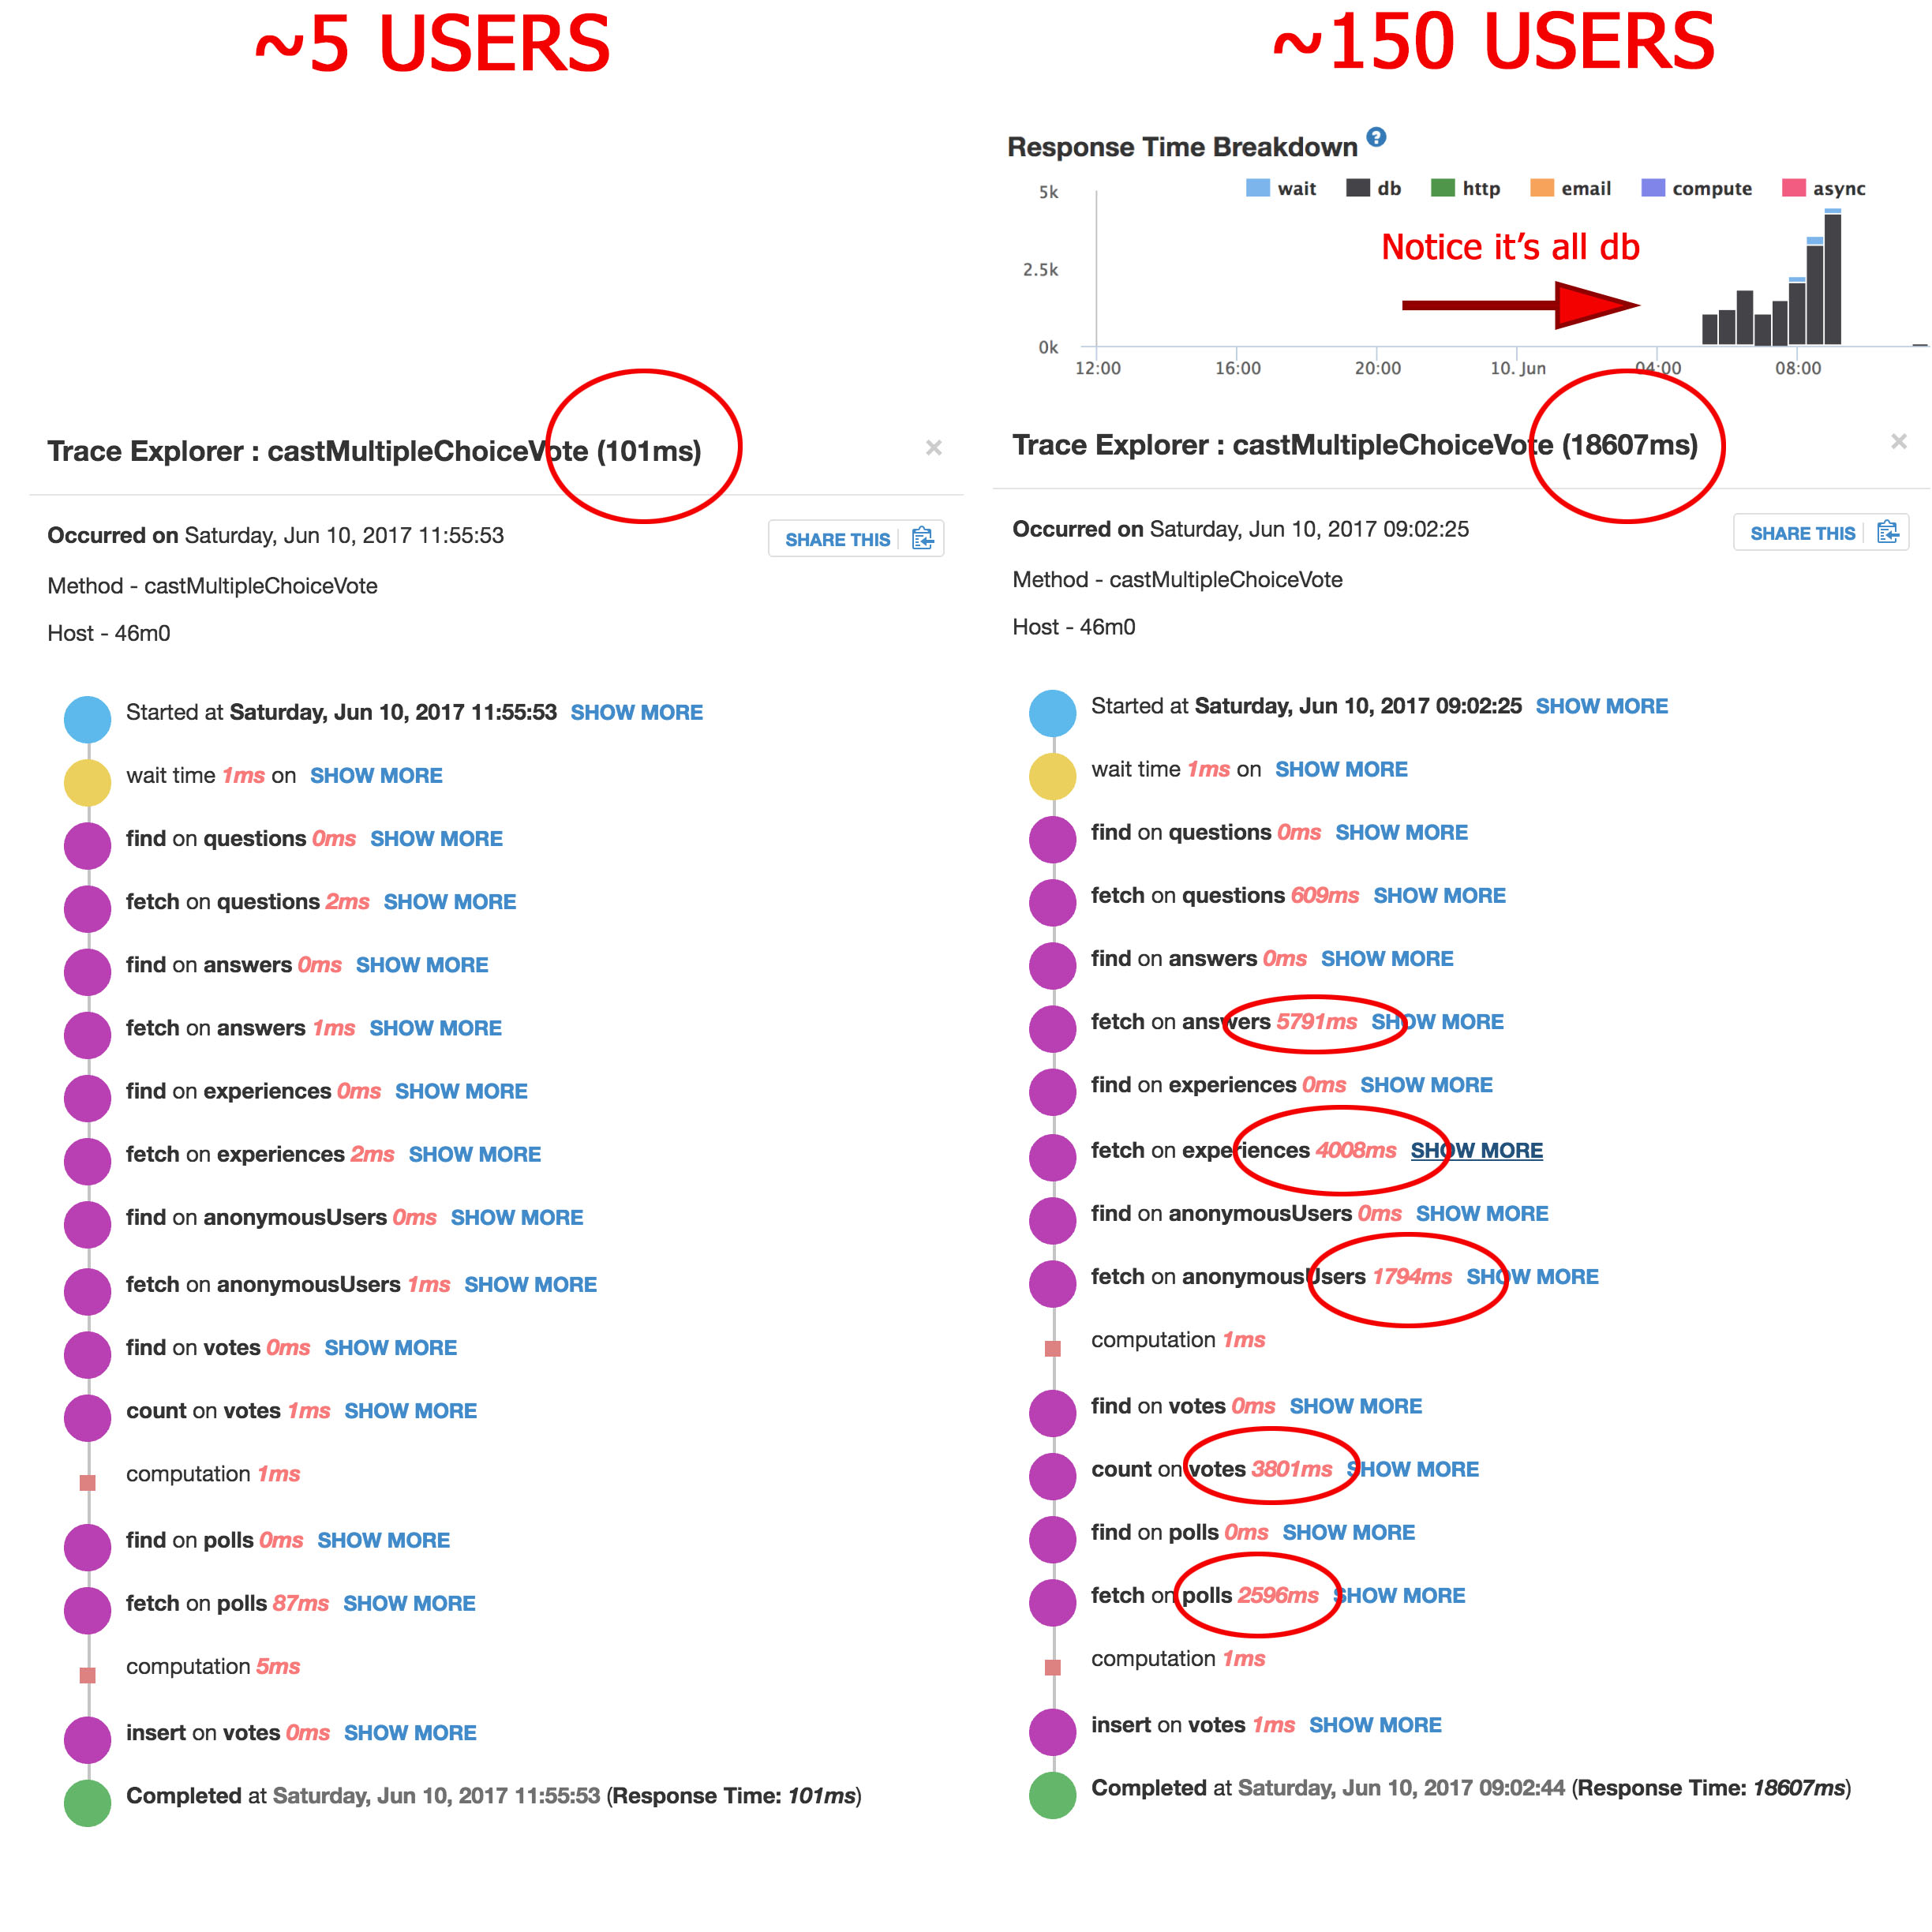
This is one of my Meteor methods that bogs down with a lot of users, but is fine with only a few. So shouldn’t this be showing up as slow queries in MongoDB?
The latest slow incident that happened was on June 10th. What I was saying was that the PRIMARY showed no new slow queries. The SECONDARY was empty for slow queries. So maybe it had been reset in the day or so after June 10th incident. So hence, no slow queries to see from the June 10th incident. I’m probably confused (I’m just an average programmer trying to make a framework work with more than thirty users ), but if the slow queries above were caused by the OPLOG, wouldn’t they be in the SECONDARY table of slow queries? Doesn’t the SECONDARY feed Meteor’s OPLOG tailing?
Okay, I wasn’t sure where exactly the OPLOG problems would manifest. If it’s my app and the CPU that are bogging down, would that cause the above methods to be so slow… with the long MongoDB query times? The way I understood it was that adding OPLOG adds a lot of extra queries to Mongo which would slow down my methods (and every other part of the app involving Mongo). Especially because I’m not querying by _id in some cases which adds extra queries (I unfortunately can’t in some cases) and we’re talking about hundreds of updates from hundreds of users… are you sure adding OPLOG doesn’t add any overhead on Mongo?
As for horizontal scaling, I have two small Galaxy nodes processing the 150 mobile-client users and one small Galaxy node for the 5 or so admin users. I was trying to keep this down to test, as the mobile-client is really simple. The only thing that makes it complex is that it’s a lot of bursty users and they all send updates to the same document as the exact same time. But there’s very little Pub/Sub reactivity.
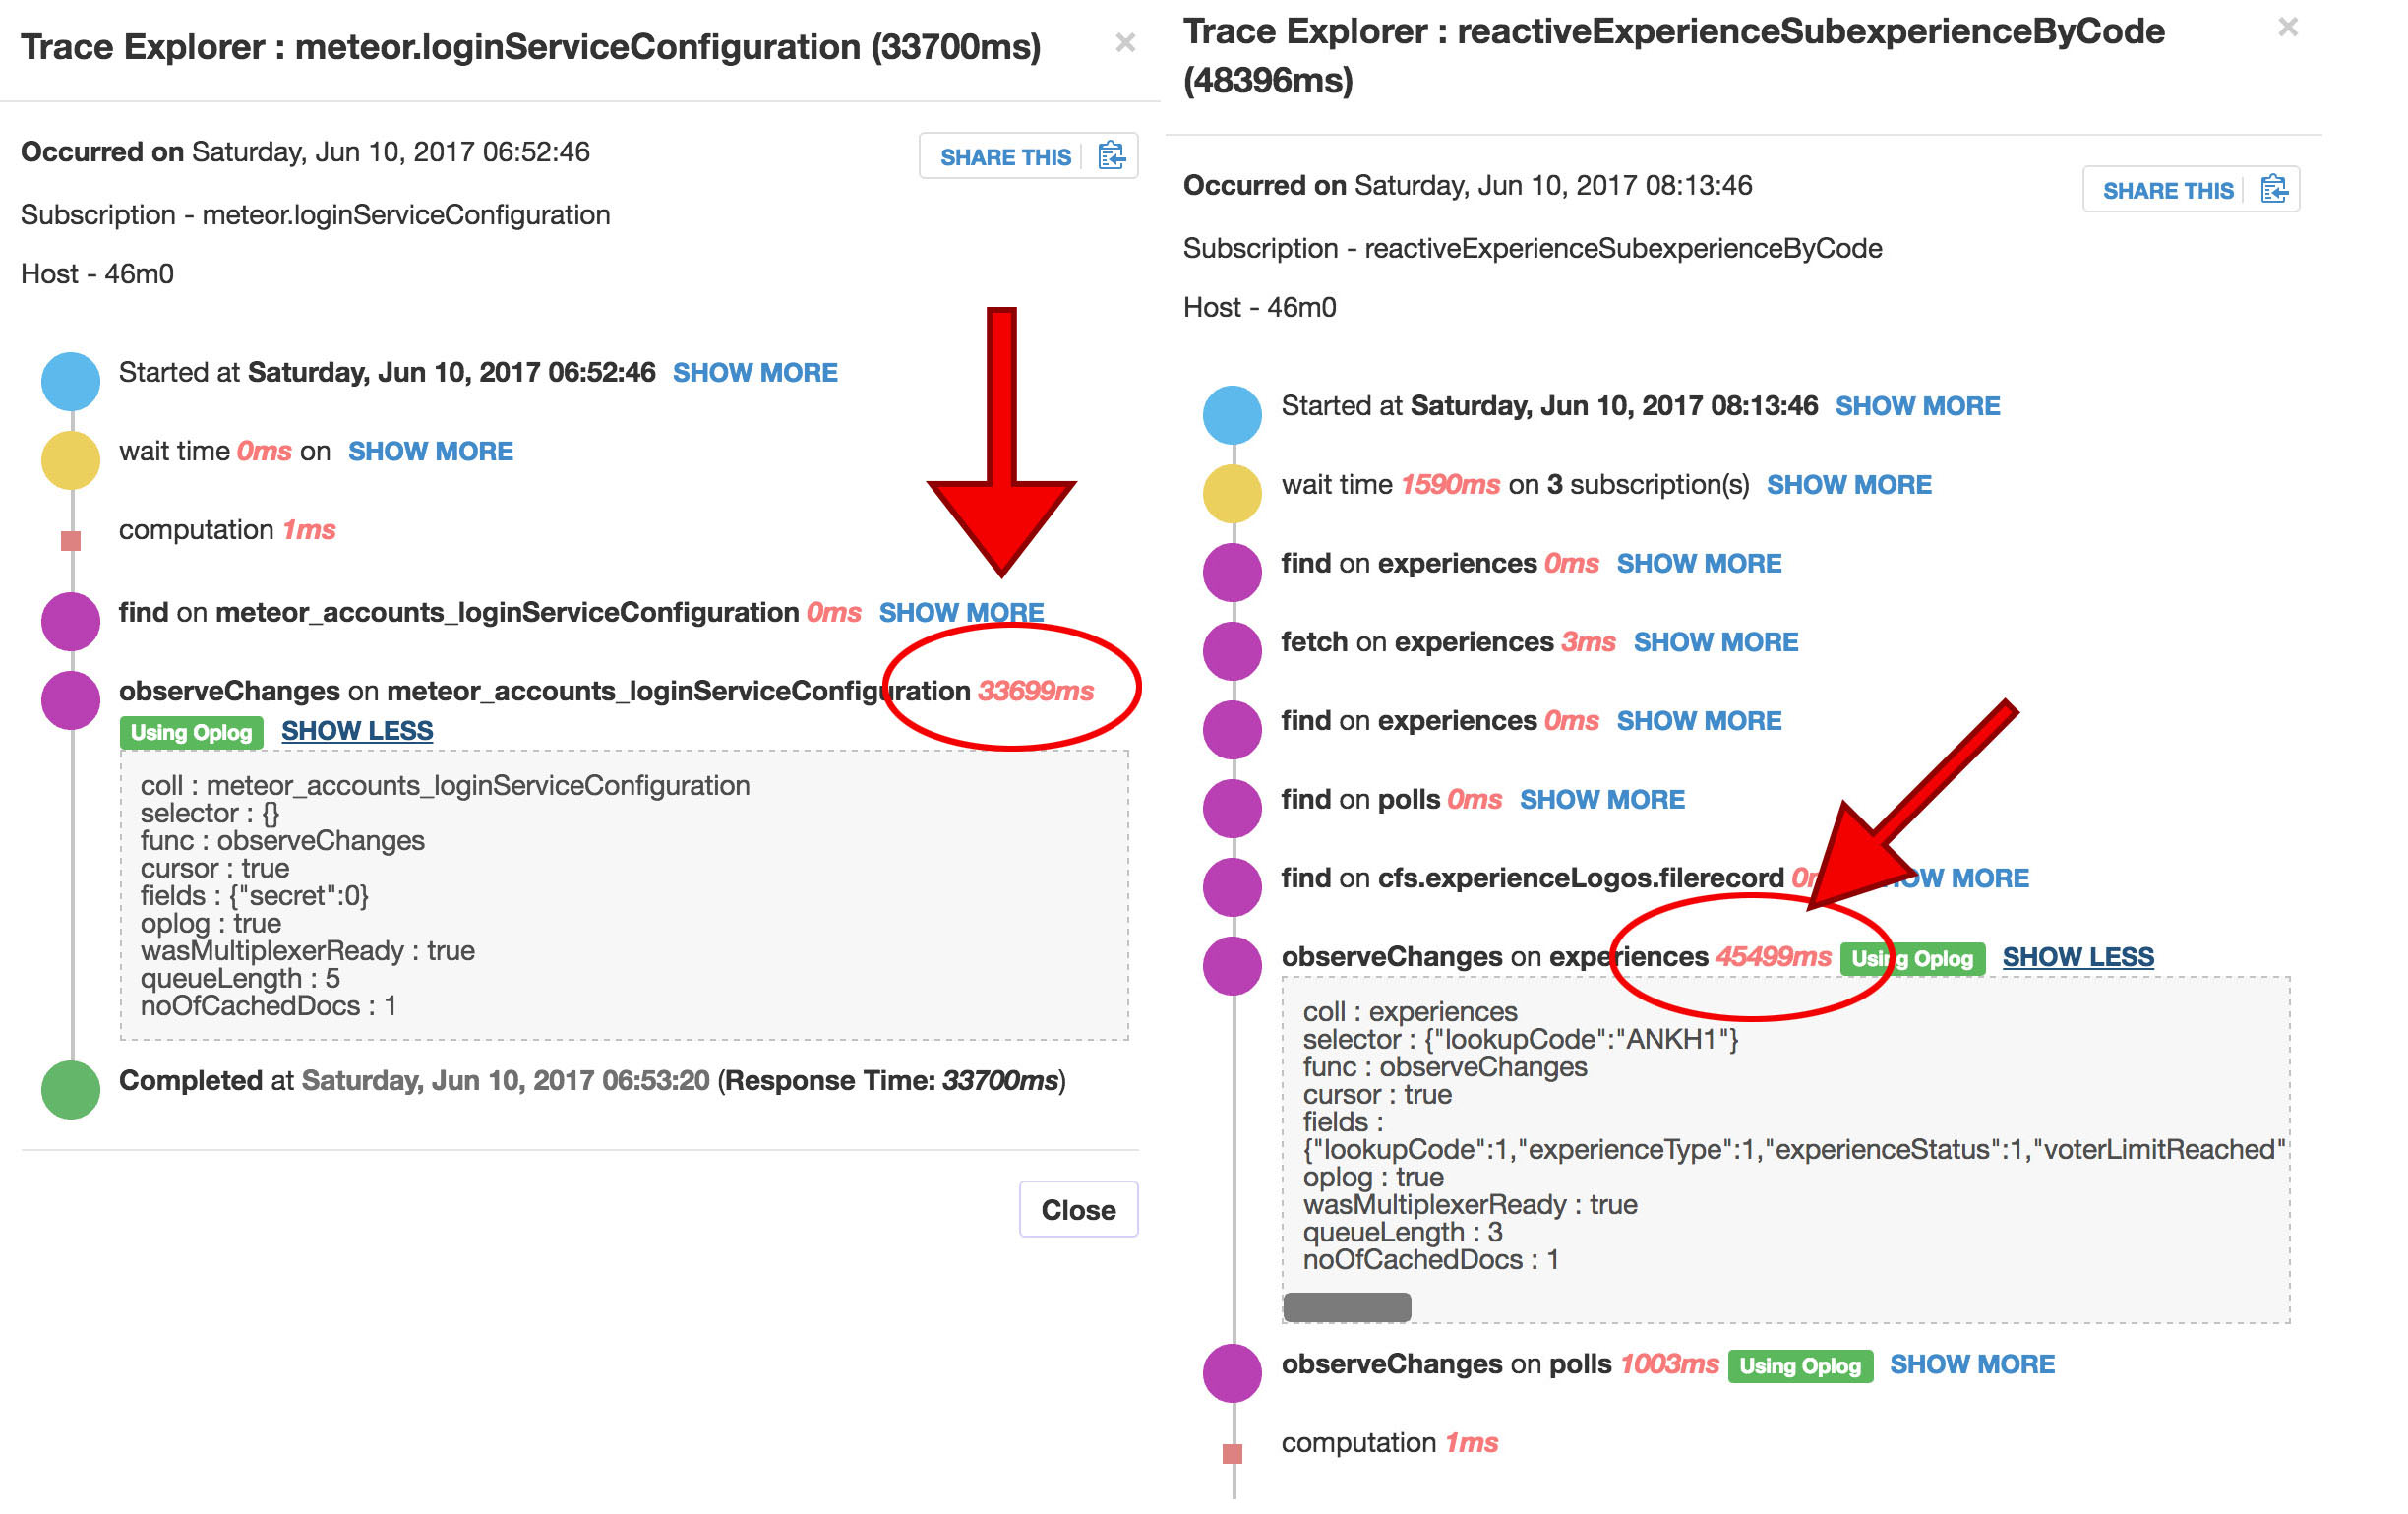
Here’s two Pub/Sub stack traces showing really slow observeChanges times on OPLOG queries… this is direct evidence of OPLOG being the problem no?
Here’s the same Meteor method call as above with “show more” clicked. FYI, I had emailed the compose.io support team in the past and asked for them to review if I had any COLLSCANS and they said they reviewed the logs and found none.
My largest collections that I query actively have document sizes like: 55093, 15221, 23337, 5316, 2077, and then smaller.
I’m 100% sure I have all my indexes covered, I have a lot of them (unless I’m doing something wrong with compound indexes). If it were my indexes that were the problem, wouldn’t my queries with only a few users be slow as well? Here’s a few of my indexes that I added in relation to the above stack trace. I’ve added no new indexes if I only query by _id:
Too many indexes can be a problem if not everything fits into memory and
then the database has to start reading from disk.
You do have some indexes that aren’t needed because you’re using compound
indexes.
Can compose tell you what the slow queries are? Even if it’s not a coll
scan it can be a difficult query for the database if it has to look over
many items. Although not too sure that’s happening here.
Also, the items kadira told you are causing a long time, there’s no way
they are the cause of the issue. Searching for an item by id will always be
quick. The reason each of those queries is taking a long time is that
something else is happening in the database which is slowing it all down.
There is a query that is locking up the entire database if the kadira
information is correct.
If you can look at the compose logs while this is all happening you may be
able to find some additional information.
Thanks for the advice on the indexes… I’ll look into that. Does it help or hurt anything to remove unneeded indexes from the indexes table in Mongo if they’re redundant?
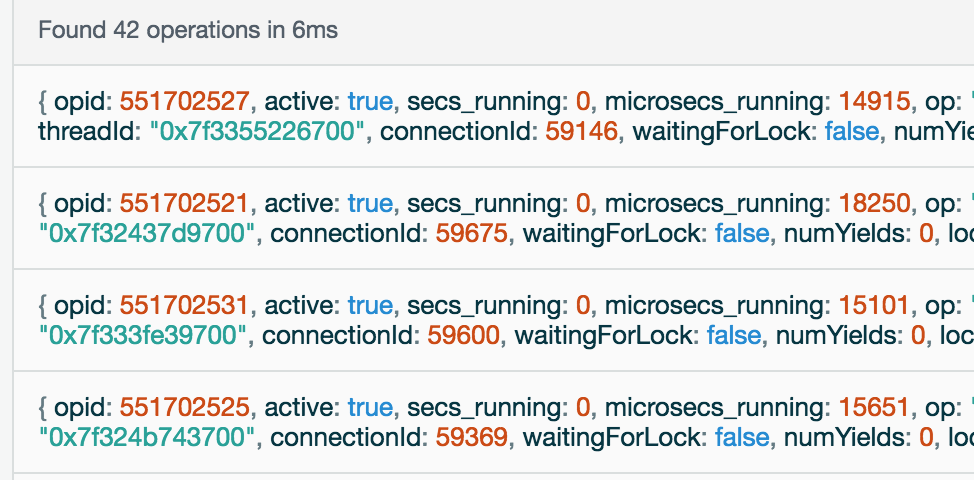
Also, I’ve read your article several times. As I mention way above in the thread, I’ve never understood how you jump from the “Current Ops” window in Compose that shows your slow queries to which actual queries are slow. The “Current Ops” window doesn’t really identify them. Mine all say op: "getmore", ns: "local.oplog.rs", query: {}.
Yes it does help to remove unneeded indexes. Each index you have takes up
more RAM. The database basically has to keep some kind of cache for each
index you have.
I don’t know if this could be your problem. You can check your ram usage.
But in general you don’t want unneeded indexes.
So, I think I’ve figured out what the issue was. Turns out the problem was my Meteor server (1 Galaxy Compact Container 0.5 ECUs) getting pegged at 100% by any burst of forty+ users. I switched my containers to Quad and cranked them up to 12 instances and had beautiful performance with hundreds of users (and can actually get away with much less containers). I think there’s still more problems and bottlenecks, but I know now it’s not Mongo because Mongo works great once I up my containers. No problem with Mongo response or Oplog. Hundreds of users logged in and were using the app in under 1 second response for all of them. I think it’s all the stuff Meteor delivers on first download of your app. I think that eats up a lot of bandwidth on the server.
The new problem is that running so many Quad Containers is too expensive. Using 1 Compact Container it only takes about forty simultaneous logins to cause my server to slow to 30+ second responses. This seems like pretty poor performance. All the above problems with Kadira and the database were likely all a side-effect of the Meteor CPU being pegged.
I started a new thread about the load tests I did to reproduce the problem and what my results were. It’s a long read but it’s probably helpful to anyone reading this thread:
Okay I read your other post. The issue wasn’t cdn stuff. And happy you finally realised that kadira was misleading and that you weren’t having db issues as I tried to point out above.
Just be careful. With Redis oplog we had some weird cases of the event of update being fired but the data was not available in the client. As soon as we turned it off the default reactivity worked again.
And if you use namedContexts with SimpleSchema, there is currently a Pull request with a bug fix for it.