TL;DR
On Galaxy, Meteor seems to only handle about 40 simultaneous logins (i.e. a burst of users) before pegging the CPU at 100% and giving other logins huge, linear-growth delays in retrieving data and loading the initial page. Adding enough servers on Galaxy to handle a bursty load works… but is extremely cost prohibitive and also a huge overkill of processing power once the burst is processed in. Wondering if this is reasonable performance or not and what I can do to remedy.
Full Details
I have a Meteor 1.5.1 production app deployed on Galaxy that is used at large live events with crowds of people. Consequently, it gets hundreds, sometimes thousands of simultaneous bursts of users hitting the app (no Meteor login required). The app for the crowd is super simple, queries a small amount of data from Mongo, and uses Meteor Methods to retrieve the data (because I previously stripped out almost all reactivity trying to solve this problem). There’s also an admin app with very few users that doesn’t suffer the same problems. Over time and growing use of my app, I’ve noticed that Galaxy and/or Meteor do not handle very many users simultaneously hitting the app in a burst and the servers quickly get pegged at 100% causing huge delays in the loading of the app, especially in data retrieval from the database in both pub/sub and Meteor Methods. The performance problems started happening after about forty simultaneous logins. Bursts smaller than forty work okay; the smaller the better. I started investigating the problem thinking it was run-of-the-mill Oplog and reactivity problems first, then possibly Mongo as a whole (which I host on Compose using the old Mongo Classic). I was hunting through Kadira/Meteor APM metrics seeing really fast database performance with a few users, but then really slow database performance with about forty users. I started stripping out reactivity (pub/sub) and replacing with Meteor Methods. I still had problems and was confused for a long time. There’s a very long thread here if you’re curious about me trying to diagnose the problems: https://forums.meteor.com/t/mongo-scaling-issues/27905/25?u=evolross.
I had a large event coming up so I decided to experiment and I changed my containers to Quad size (4.1 ECU) and increased the container count to 12. Low and behold my app ran flawlessly, in seconds, for hundreds of simultaneous users. No Mongo/Compose problems, no Oplog problems. It was the “burst” of users logging in, overloading the small container that was causing all my problems. I never considered that this could be the problem because I’ve seen one Compact Container (0.5 ECU) on Galaxy handle 400+ connections and users at the same time in my app. If the users hit the app in a slow, ramped fashion, a Compact container works great. It’s the burst it chokes on and I’m assuming all the goodies that Meteor has to deliver upon first load to the browser.
What I discovered finally is that if your Meteor CPU gets pegged, all kinds of wacky stuff happens. Kadira/Meteor APM metrics can get misleading, Galaxy metrics can go bonkers (especially connection counts), worst of all, response times go through the roof on a linear scale (see graphs below). Especially having to do with database queries from both Meteor Methods and pub/sub. The initial/static HTML still loads fairly quickly, but the population of data into the page, even with the use of non-reactive Meteor Methods, hangs for an unusually long period of time. I was having users staring at my loading animation for up to sixty seconds. And then usually refreshing many times in between causing more load. I’m not sure why the database data delivery is the hang up and why that starts to run slow versus the HTML, CSS, etc. Those seem to still load quickly even in the burst. And you can also see this phenomenon in my graphs below.
So… I set out to load test my app to test that this “bursting” was actually the problem. I needed to simulate hundreds (if not thousands) of realistic users hitting my app at the same time (read: not ramping up over five minutes - which is unfortunately what a lot of cloud load testers offer when you need to scale up users). This topic deserves an entire thread of its own. Through many days and hours I learned that it’s difficult to properly load test in Meteor. The problem I found is to actually reproduce the problem, I had to have real (or at least headless) browsers hitting my app - and lots of them. So JMeter, Gatling, and a whole variety of web/cloud load testers (even a lot of major providers) were unusable because they only test HTTP traffic. They don’t simulate button clicks calling JS functions and the resources downloading, javascripting, database calling, reactivity, Oplog work, etc. etc. of actually loading your Meteor app. These load testers are usually old school. You can run them on your Meteor app and Meteor performed quite well just serving the HTTP of my app. I ran a JMeter test with 1000 simultaneous hits to my app from my desktop and a Compact container performed great, but that’s only serving the HTTP of the page. Galaxy doesn’t even register these hits as “connections”, but it did show a minor CPU hit. So these types of HTTP tests work, but they don’t come close to actually reproducing the problem.
I found the only way to reproduce the problem was using a cloud service that actually launches browser instances across distributed machines. And headless browsers work fine (e.g. PhantomJS) as long as they process the JS of your page and trigger a proper Meteor “connection”. Headless is better because you can run more browser instances per test machine versus launching real Firefox, Chrome, etc. The problem is this type of load testing takes a lot of horsepower and machines, and this gets expensive quickly. There are cloud load tester apps that will charge hundreds to thousands of dollars per month to perform tests like this. I looked at a lot of them. 95% of them are too expensive for my app. Amazon Mechanical Turk is also too expensive when you need hundreds/thousands of users. I can’t afford $999 per month and I also can’t afford $50 per test. The very best solution I found for my use-case (which I know is kind of a weird edge-case) is www.redline13.com. Their service actually has a free tier that lets you connect your own AWS credentials, spin up your own EC2 instances, and they take care of firing off your tests for you and handling all the behind-the-scenes setup of your EC2 instances to start and run PhantomJS. You just pay for your EC2 usage. They can even load super-cheap Spot Instances and let you re-use them for a whole hour. This makes doing tests of hundreds/thousands of users costs pennies per test. ![]() They support a variety of tests, but their Node.js Webdriver integration works fairly well and makes each user connect and you can also script a user-case including buttons, forms, etc. And best of all, all the instances fire off almost simultaneously. Webdriver can do almost anything. And their PhantomJS reports back tons of useful metrics that Redline13 saves for free (see below). Redline13 has some paid plans that involve support and extra features (like test replay and cloning).
They support a variety of tests, but their Node.js Webdriver integration works fairly well and makes each user connect and you can also script a user-case including buttons, forms, etc. And best of all, all the instances fire off almost simultaneously. Webdriver can do almost anything. And their PhantomJS reports back tons of useful metrics that Redline13 saves for free (see below). Redline13 has some paid plans that involve support and extra features (like test replay and cloning).
If you’re interested in load-testing this way, here’s a link to their tutorial for testing like this:
https://www.redline13.com/blog/2017/02/selenium-webdriver-cloud-performance-testing/ and also a YouTube walkthrough: https://www.youtube.com/watch?v=GWBrfucwBtI (both super helpful).
On a quick side-note, getting Redline13 to work properly took a lot of trial and error. When something is free, there’s usually a reason. So there are some quirks and gotchas (I may write a tutorial about creating a Meteor test and running it on Redline13):
-
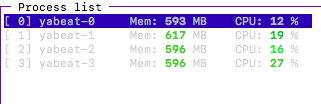
You need to run a powerful enough server to run your PhantomJS instances or risk running into problems and anomalies with your testing machine not having enough CPU to run the test instances. There’s a metric on the Redline13 results under Agent Metrics stats that shows “Load Agent CPU Usage”. Make sure this never pegs at 100%. If it does, not all your instances will run. I recommend an M4.16XLarge (or several of them if you’re testing in the thousands of users). One of these boxes can handle hundreds of PhantomJS instances.
-
I also recommend having your use-case “do something” like adding a document. That way you can count how many documents were added and verify that the total number of documents matches your instance count to verify all your instances ran as expected. Otherwise it can be hard to tell if they just, for example, hit the URL of your app.
-
Tests can take a few minutes to spin up. Be patient. Check for errors at the bottom of the results page. You can run more tests using the same EC2 instances you started. They’re available for about an hour. And use Spot Instances, it’s way cheaper.
-
I could only get testing in PhantomJS to work. Firefox and Chrome are also offered, but both of them returned errors. I emailed Redline13 about this and they said they’re working on fixing it. As I mention above, PhantomJS is more efficient anyway. PhantomJS also occasionally fails to run every now and then, never figured out why.
-
I also got errors with JMeteor cloud testing on Redline13. However, as I mentioned above, this won’t test your app properly and you don’t really need a cloud to run a lot of users (threads) in JMeter anyway. You can do plenty just from personal machine.
Note: I’m plugging Redline13 a lot because they offer a TON of value for no charge. Would love to help them get out there more.
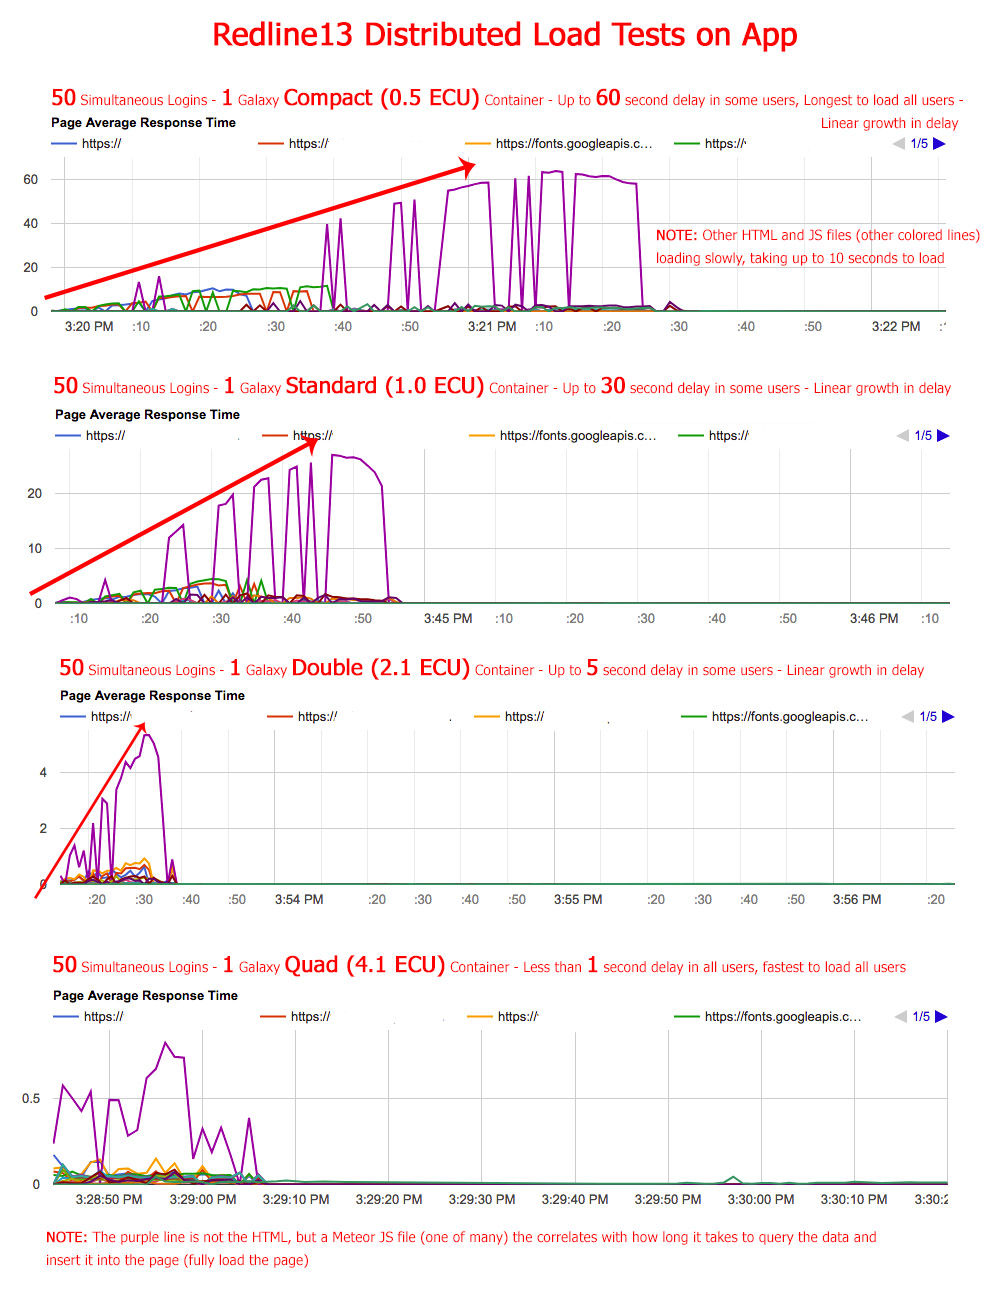
So, on to the testing. I was indeed able to reproduce my problem. Very easily. The first image is a series of response graphs showing a linear growth in response time up to 60+ seconds of my app when running 50 users on a Compact container. This correlates exactly to real user feedback and my own results using my app along with a crowd of people. Each following test and graph, I increase the container size thus increasing the ECUs. Each test shows better response time and performance.
Here’s another set of graphs showing the Galaxy performance in each test:
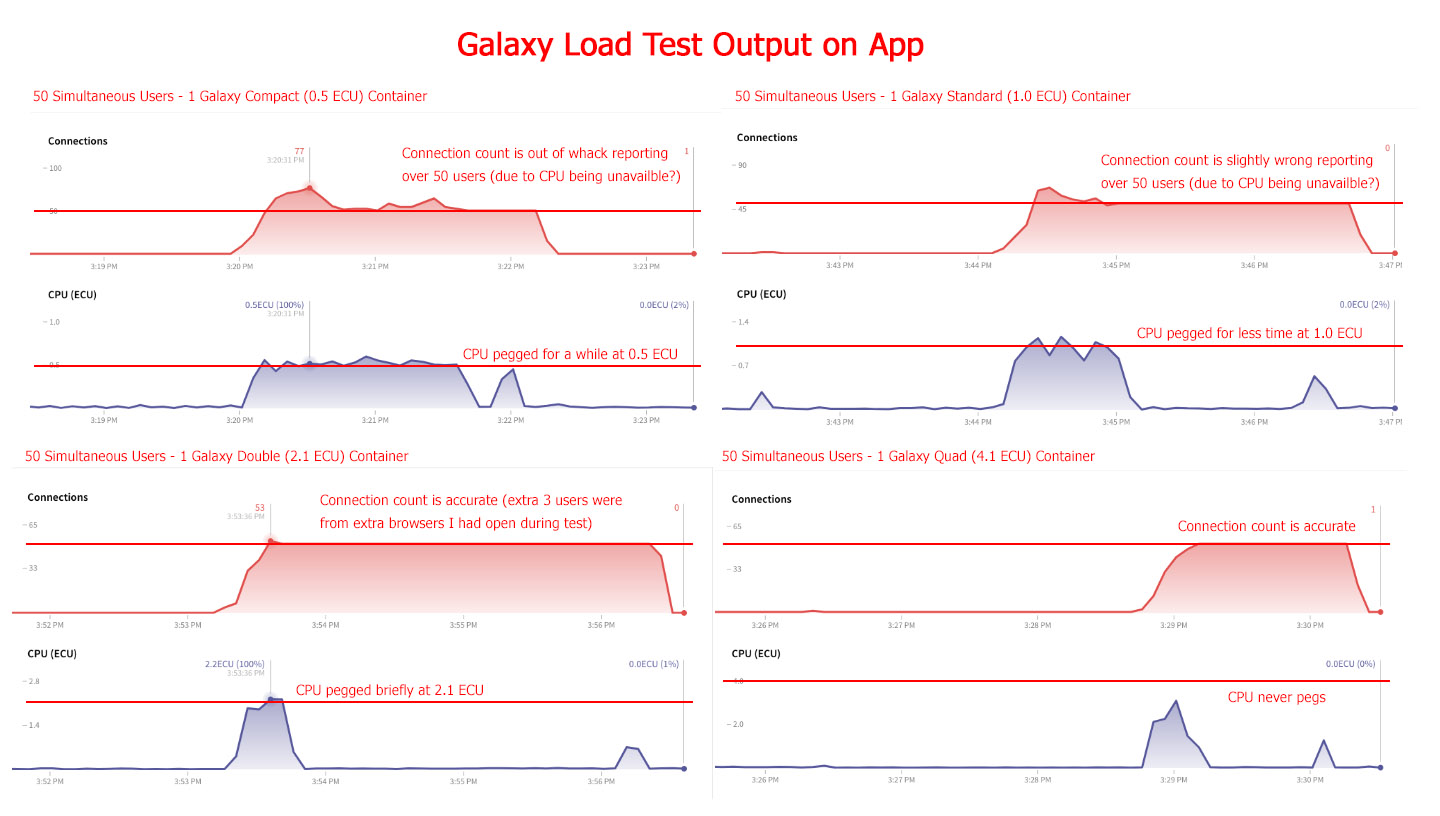
You can see how easily a Compact Container gets pegged. Note the final graph that shows a response time of less than 1 second for 50 simultaneous users. So no problems with Oplog or the database. Or at least no problems with the database. Perhaps I’m throwing enough horsepower with a Quad Container to chew through any Oplog issues, but I’m confident I don’t have any Oplog issues because once my users log in after the burst, hundreds of users can use the app with no problem on a Compact Container with Oplog functionality working great. All of these tests are on a single container. I’ve found that these results duplicate in the same way when adding containers. So adding 4 Quad Containers will handle 200 simultaneous users with similar performance as 1 Quad Container handled 50 simultaneous users.
So I’m now able to reproduce my problem. The next logical question I had was “is it something about my app?” Is it too complex, too much reactivity, am I doing something grossly negligent (which is very likely ![]() ) etc.? I had a feeling my app was fairly efficient because it’s quite simple and I use a bare-minimum pub/sub that is highly re-used by the crowd using the app. So I thought I would test the latest Meteor
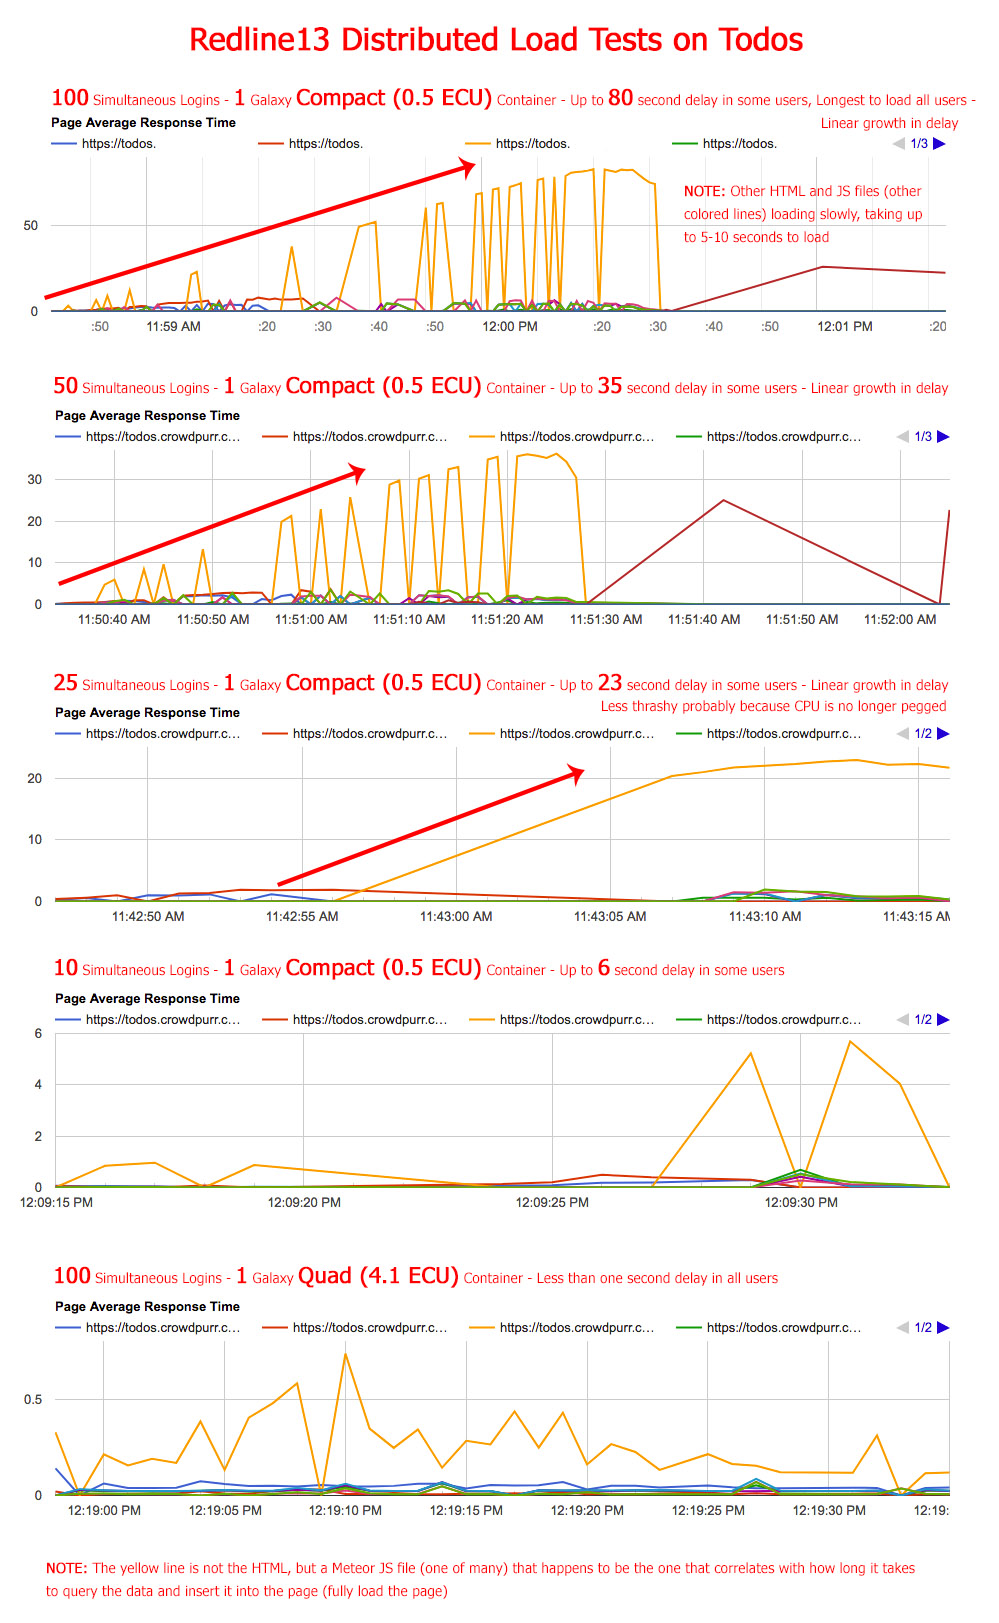
) etc.? I had a feeling my app was fairly efficient because it’s quite simple and I use a bare-minimum pub/sub that is highly re-used by the crowd using the app. So I thought I would test the latest Meteor todos app. So I cloned it and uploaded the latest version on Galaxy and put the database in the same Mongo Classic deployment as my app on compose.io. This test is slightly different than the above. For my app, I kept the simultaneous users the same and upped the container size just to prove my app could work fast and the database wasn’t the problem. For the todos test I wanted to see if its performance would bog down like my app, so I keep the container the same (1 Compact) and changed the simultaneous users starting with a high user count and lowering it each test. Here are the results:
And the Galaxy results:
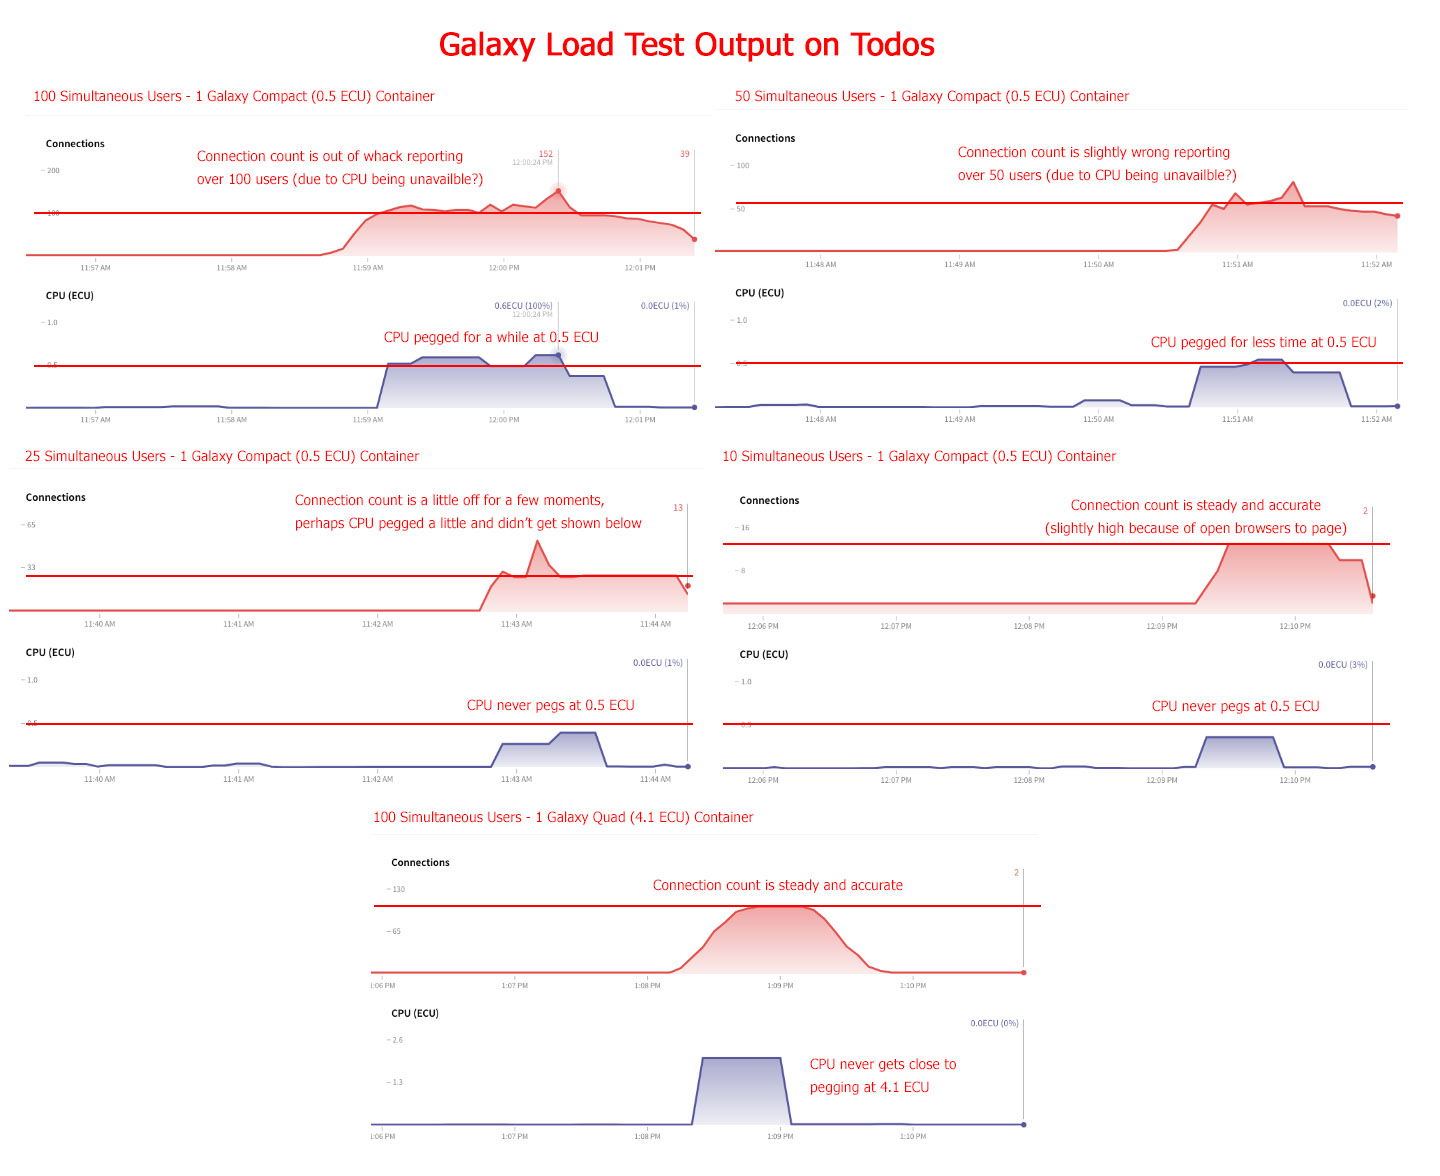
So you can see the todos app, quite similarly to my app, bogs down around 25 to 50 simultaneous users returning really slow performance. I could also witness this delay with my own eyes in my own browser. In the middle of the high-user tests, I tried to hit the todos app I was hosting and it would take 30+ seconds to load all the data into the HTML, exactly as the test results show. I did one last test you can see above in the todos app with 100 simultaneous users on a Quad Container and it chewed it up returning all users in less than one second response time per user! So Quad is awesome, but it still boggles me why a Meteor app needs so much power to deliver first page downloads.
Lastly, I thought it might be good to test a brand new, blank, Hello World Meteor application. One with no packages, frills, or even database connections at all. The good news is it has much better performance. I’ll spare you the graphics:
10 Simultaneous Users on 1 Galaxy Compact Container: Under .5 second response time for all users
25 SimultaneousUsers on 1 Galaxy Compact Container: Up to 1.2 second response time on some users
50 Simultaneous Users on 1 Galaxy Compact Container: Up to 1.5 second response time on some users
100 Simultaneous Users on 1 Galaxy Compact Container: Up to 6 second response time on some users
200 Simultaneous Users on 1 Galaxy Compact Container: Up to 12 second response time on some users
This seems like great performance. I would love to get my app and the todos app performing like this. But both of those apps involve the database, pub/sub, Meteor Methods.
In closing, at the end of the day, I have the following questions:
-
Am I crazy to expect such performance in a simultaneous fashion? Is this performance good/typical/reasonable? Is more than 50 simultaneous users too much to expect on a Compact (0.5 ECU) container? Is 0.5 ECU very little? I don’t know much about ECUs. It seems low considering a Compact container can handle 400+ users in my app once they’ve logged in. In order to handle 1000 simultaneous users I’ll have to scale up to 5 Quad Containers at $317 per month each that’s $1585 per month. Handling 5000 simultaneous users would cost $7925 And all of this would be a massive overkill of CPU once my users have logged in past the burst and are just using the app.
-
Are there any strategies to handling my use-case? Is the poor performance from all the initial goodies that Meteor delivers on first download? Is there a way to hook in some other kind of server to help with this? I thought about packages like
simple:restto rebuild the front of my app in a REST-driven format, but eventually my users will need to hit the real Meteor app. And they will still be doing so in huge waves. I could try to delay their querying of data or intelligently throttle it. As long as the assumption is true that simple “less-database query-oriented” pages affect the CPU less than normal pages that query a lot. Like maybe I could create a quick-loading landing page and then get them the data from there. I’ll run another load test in my app just loading a basic “Hello” page that doesn’t query data until the user clicks a button… just to get them “into” Meteor without querying data. -
Should I rebuild this part of my app in a totally different stack? Something more capable of bursts of users? Perhaps stop using Galaxy and roll my own stack to deploy with? Would switching to AWS help versus using something like Galaxy?
Sorry about the length. Thanks for reading. I thought this could help a lot of people.