I’ve noticed that in Galaxy it shows CPU spikes on our servers to 70% or 80% sometimes, but when looking at Meteor APM the graph doesn’t show anything above 10% CPU usage or so. Does anyone else see this type of discrepancy or know what would cause that? It’s hard to know which I can trust as correct.
Hello @efrancis ,
We report this CPU difference between Galaxy and APM in our documentation.
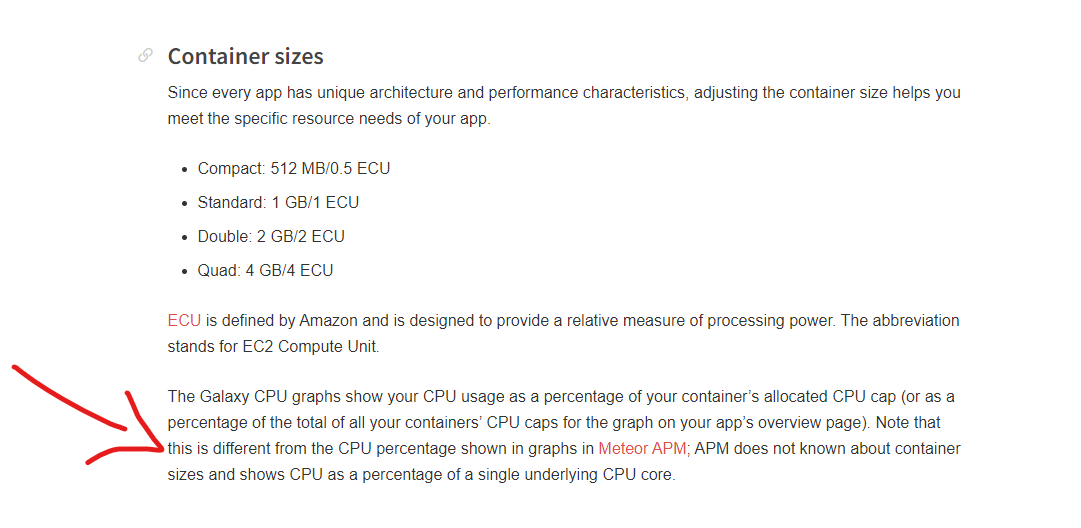
Follow the link: Containers | Galaxy Docs
Anyway, I will take this ticket to our dev team, we have some tasks in our backlog to improve APM, soon we will publish more news.
Best Regards,
Philippe
5 Likes
Thanks that makes sense. It’s a confusing UX tho, ideally APM would show usage % of total accessible CPU. The current setup has made it a little tricky to hunt down CPU spikes in prod sometimes.
Yes, it really makes sense. As I said, I will bring these questions to our next meeting next week.
Thank you for the explanation.
Best Regards,
Philippe