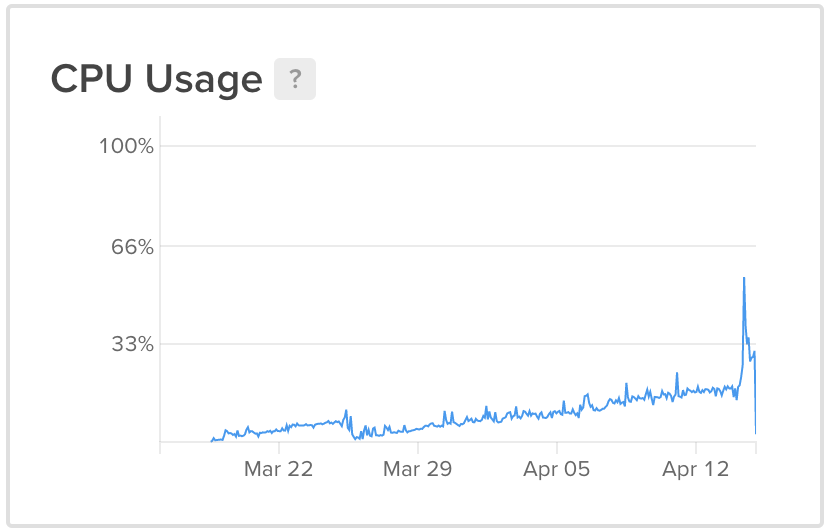
Any idea how to troubleshoot/solve this issue I’m facing… The CPU on my production node(s) increases steadily over a matter of weeks. Any tips appreciated. I have started using node Events recently (but also upgraded Meteor from 1.8 {the latest version [now using Node 12] does seem to need more RAM & CPU for sure} and changed a few other packages etc.) so cannot pinpoint the issue easily as it takes weeks to manifest.
The dip around the ~26th March was a deployment, which resets CPU usage back to zero for a while.
Interesting I have never seen a CPU usage increase steadily like that…this looks like a memory graph…do have any scheduled jobs? Or perhaps some computation that increases linearly with data?
I came here just to open the same discussion… This is a standby web application. 2 users doing minimal user tests once in a while. The drop was indeed a server restart. No scheduled jobs or any code difference from 1.8.3.
I posted this in the past: Memory Utilization is running high - #4 by paulishca It looks like those “saw teeth” are now adding up like … a desire which is not being released and keeps accumulating in various parts of the body … if I may …
Very interesting and very similar. Good to know you had no code changes…
I guess we need to profile and see what is using those CPU cycles. Doing this in a non obtrusive way (when the issue only manifests over weeks) is the tricky part.
Can profiling be enabled dynamically? To run in production with profiling permanently is not feasible…
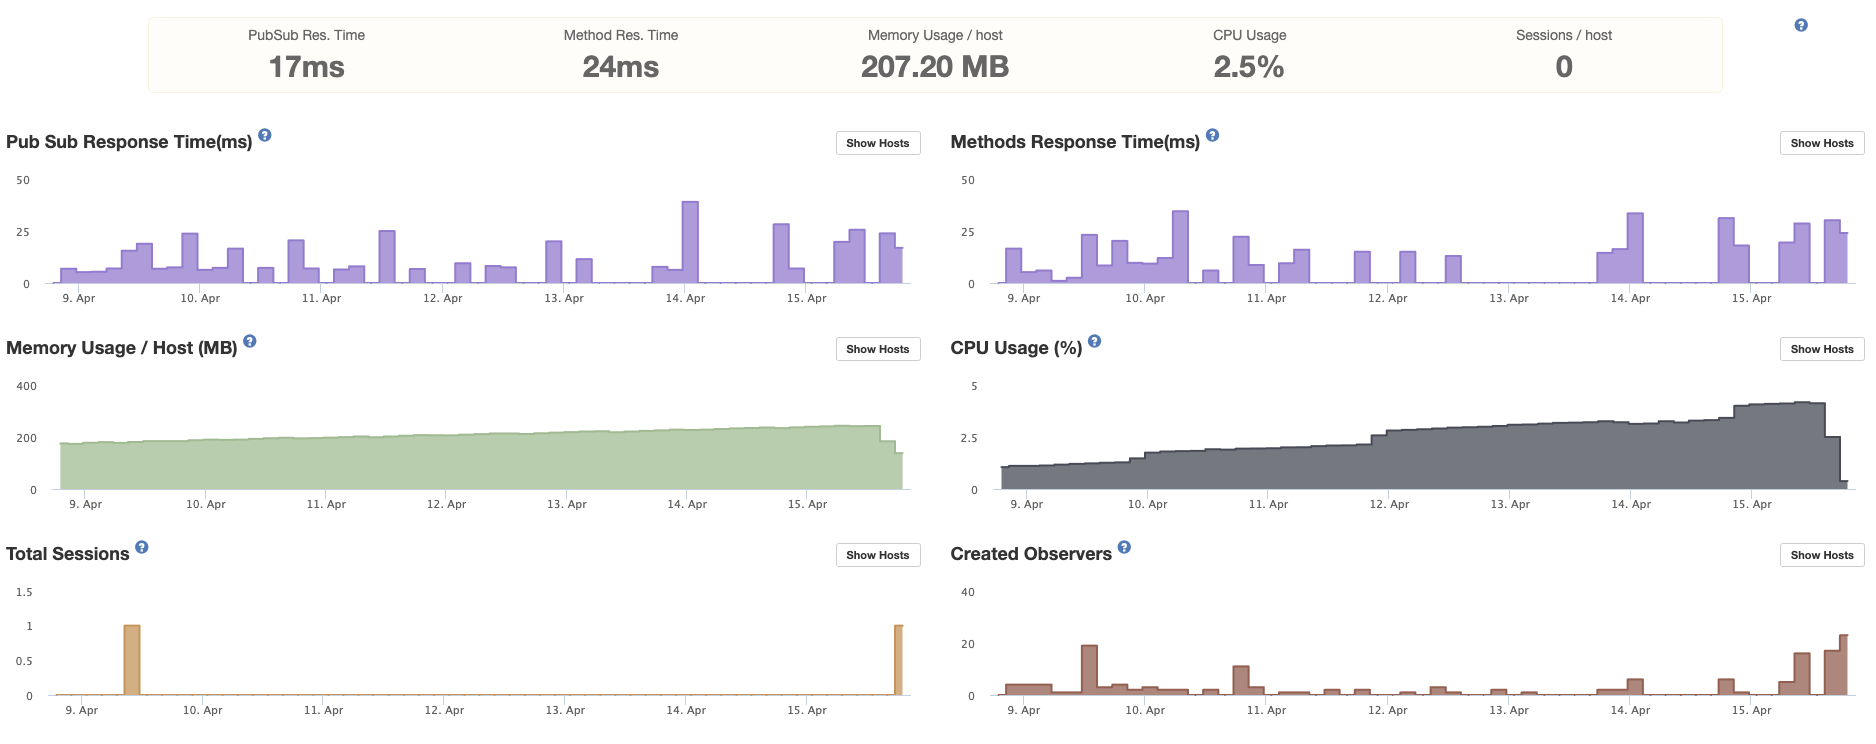
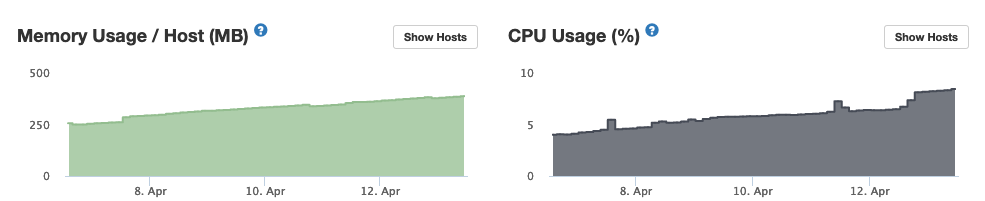
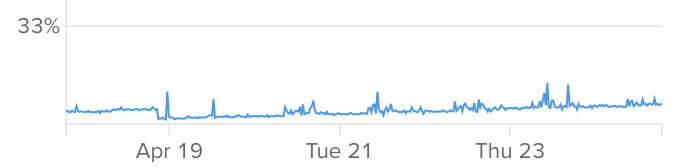
I am having a similar problem. Since I’ve upgraded to 1.10.1 I am observing both CPU and Memory slowly and steadily growing. Here just last week’s view:
Upon first start, node was using just 150 MB of memory.
Over time this is growing up to a point it reached 500MB.
I restarted node, and it’s back to 135MB, but I see it’s again slowly growing memory utilization.
CPU we can also see it’s steadily growing, but since values are slower, the increases are also small, and it takes longer to observe the growth.
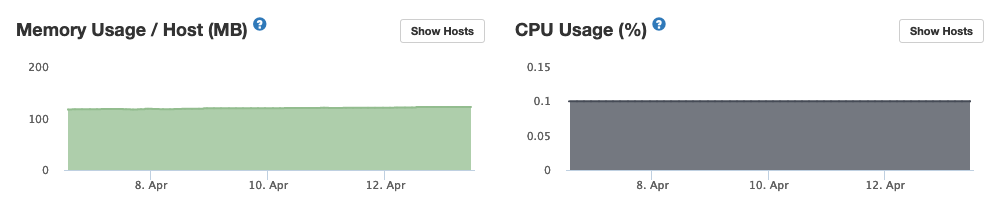
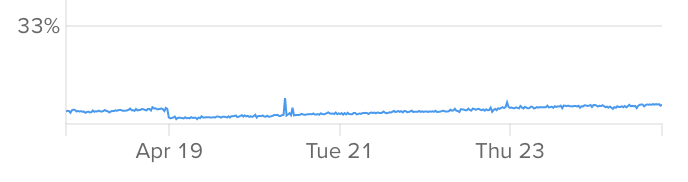
This is my PROD environment, and I have an exact same environment, version and code on an INT environment, but there I DO NOT observe this behavior. Here’s the INT graph for the same week:
If you are using Meteor Up, you can run run npx --package mup@next mup meteor debug to use Chrome’s DevTools for Node to take CPU and memory profiles. The feature is part of the 1.5 beta, but it still works when the app was deployed with older versions. Also, Monti APM’s paid plans provide a remote cpu profiler.
I am working on a low overhead continuous profiler service (initially for CPU, but eventually for memory also). If anyone wants to join the private beta when it is ready, you can send me a message.
I think it would be ok now to open an issue for this matter so we can track it. At least for me it is clear that 1.8.3 and 1.10.1 have different patterns with the same code and same standby usage.
For people seeing the problem. Can you also mention which is the last version you tested where you didn’t see the problem. And specifically if you saw it on 1.9
Unfortunately I skipped 1.9 due to various factor including ironically Mongo client version. More below.
I switched to a blue/green deployment (with DNS failover) this week and see the same CPU increase over a matter of days across both nodes. The warm node is occasionally used for admin, but no user traffic. So I don’t think it’s a flaw in my app code.
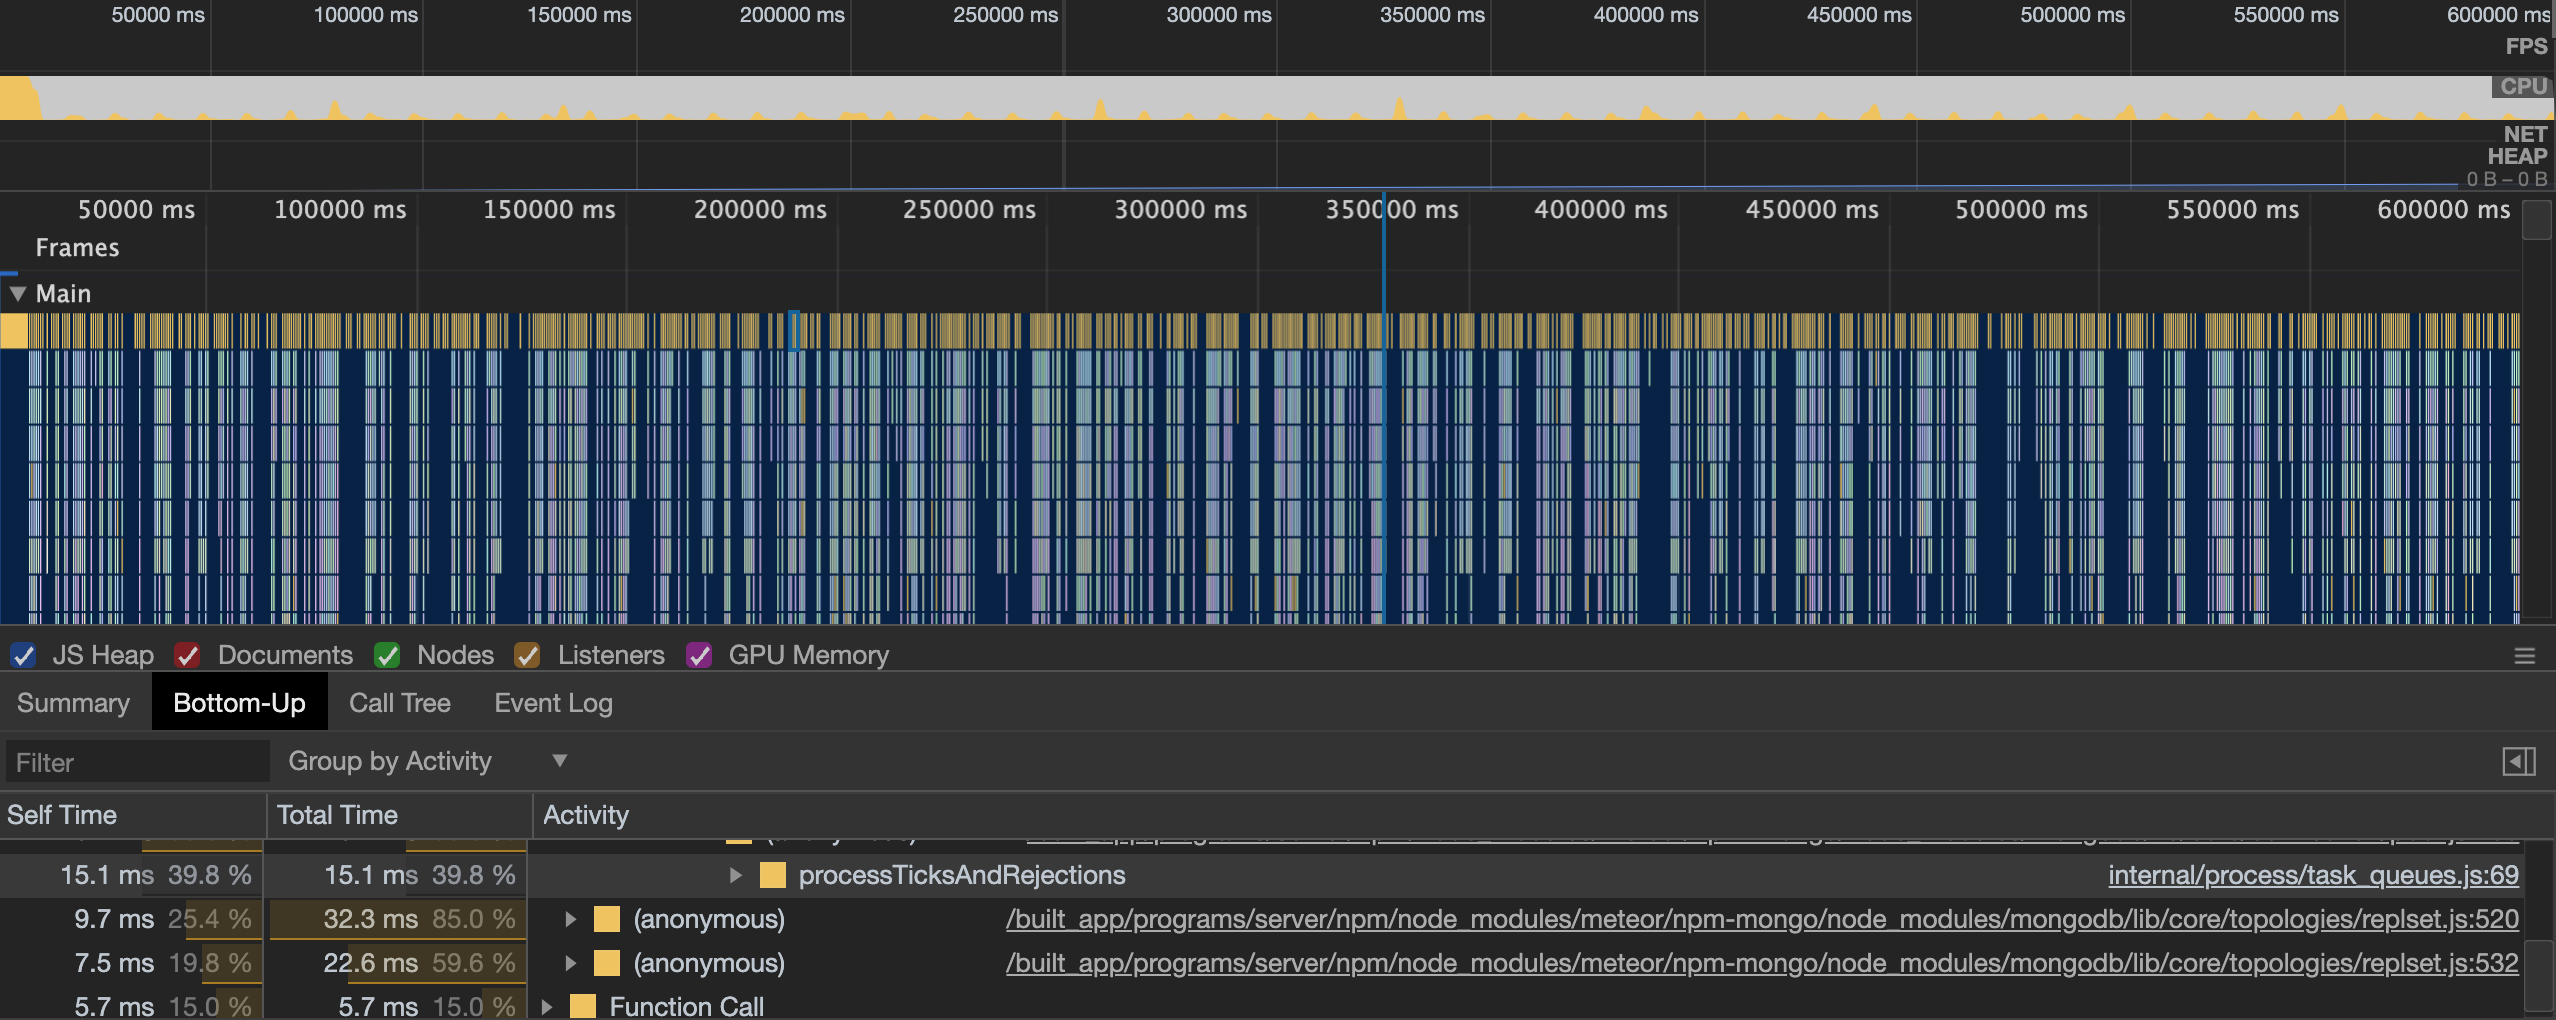
I’ve attached the node js CPU profile (on github issue) I took for 10min on the GREEN/warm host. You can import into Chrome devtools but I’ve included a screenshot below.
My observations:
Some timer is running every 10 seconds
A lot of the CPU time is spent in the npm-mongo package and also in processTicksAndRejections()
Not experienced analysing cpu profiles though so any input appreciated…
Hi guys, maybe this was related to an issue on npm mongodb driver, it was updated already in the Meteor wrapper as well, read more here https://github.com/meteor/meteor/issues/11026
This issue is a good example of why having a community of people with more or less similar stack (specailly backend) is a good thing as oppose to a siloed communities for the build system, view layer, data layers etc… The system needs all the part to work well together to be of any use.
NodeJS is a set of many small libraries which is not a bad thing. But maintaining and debugging those integrations is not an easy undertaking. In this incident, we’ve a group of smart people identifying, isolating and fixing the issue for which the rest of the Meteor community is grateful.