Performance and stability problems at scale

Intro
We have a problem. For a couple of weeks now, one of our app that heavily relies on real-time features has stability problems. Let me walk you through all of our findings, ideas, experiments, and questions.

Background
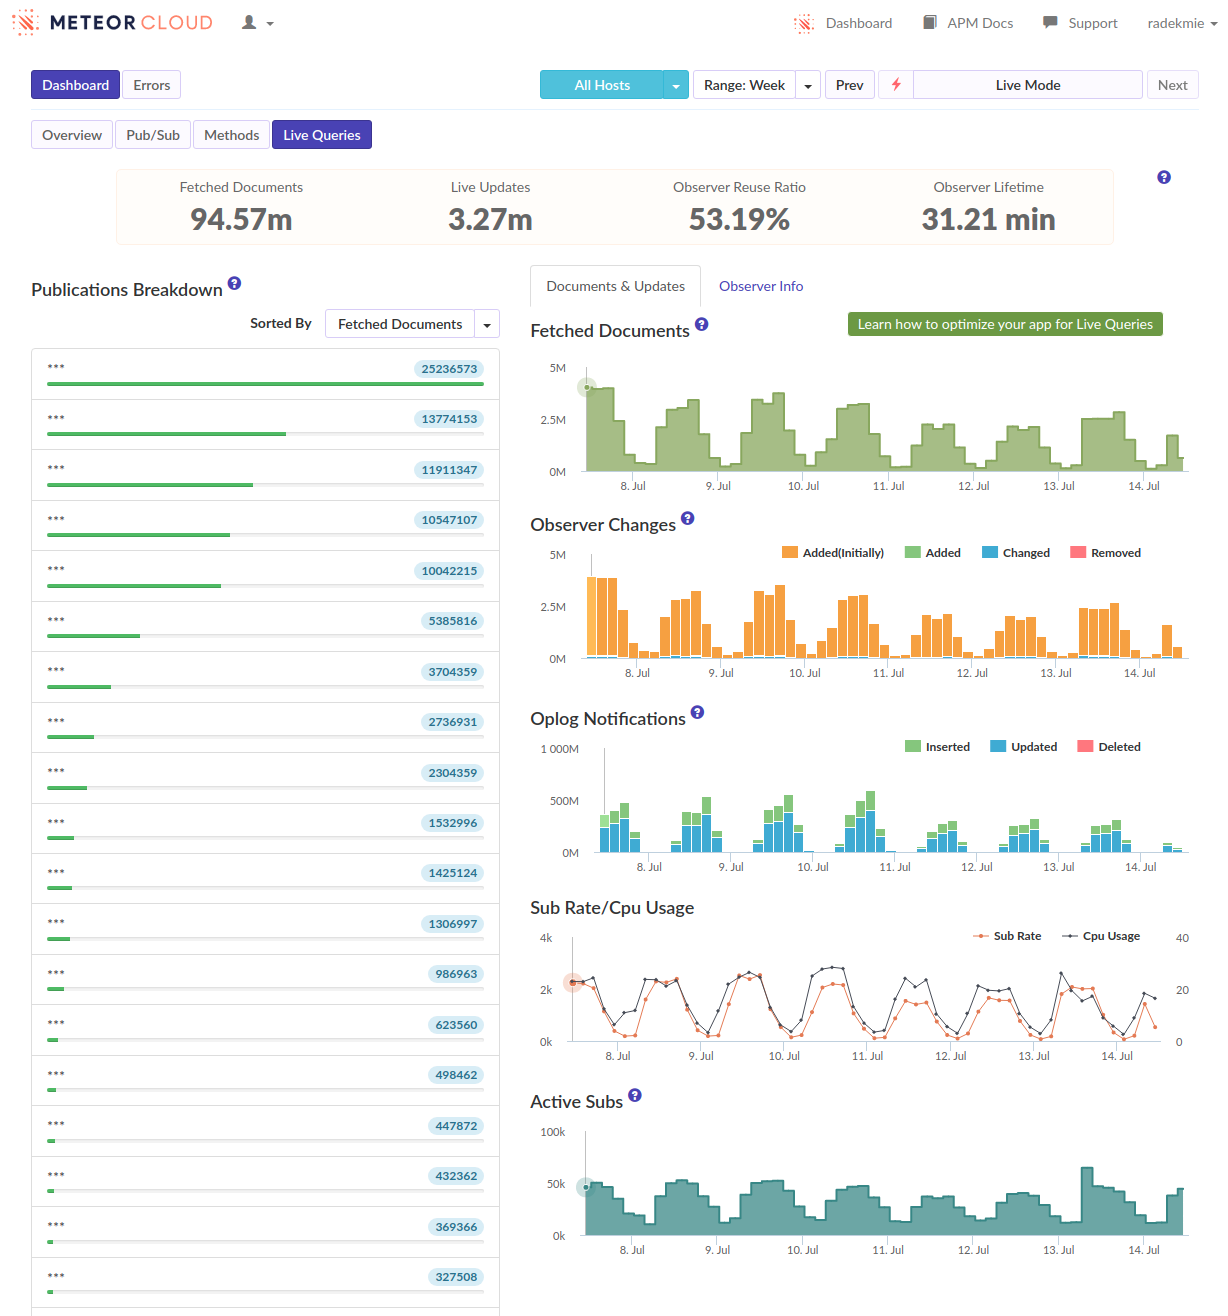
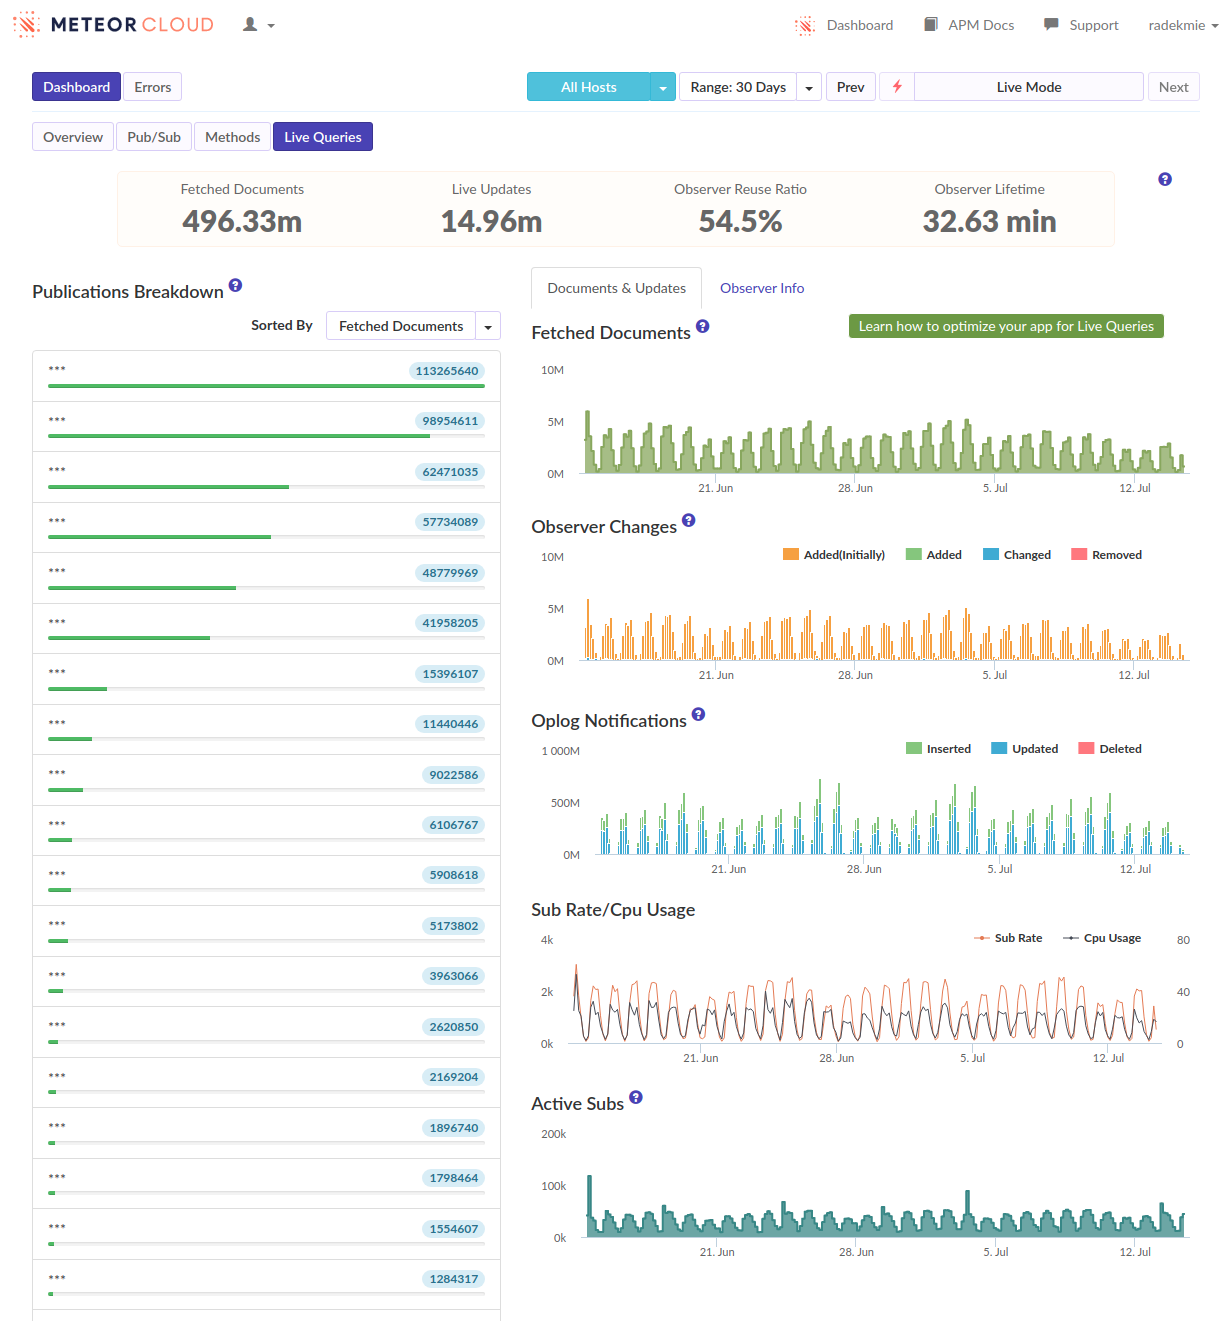
The app has to be real-time and any latencies may cause actual business problems. (Nobody will suffer from it, but hey, you get the idea.) The amount of data is let’s say moderate in terms of size (less than 1MB per user) but highly scattered (hundreds of documents; most users will have between 200 and 1000 documents loaded). The data itself changes rather rarely during the day but often occurs in batches.

The usual way of working with the system is to start it in the morning, leave it open through the day and close in the evening. About three weeks ago we significantly expanded our userbase. Most importantly, many of the new users were starting using the system during the day, not in the morning.
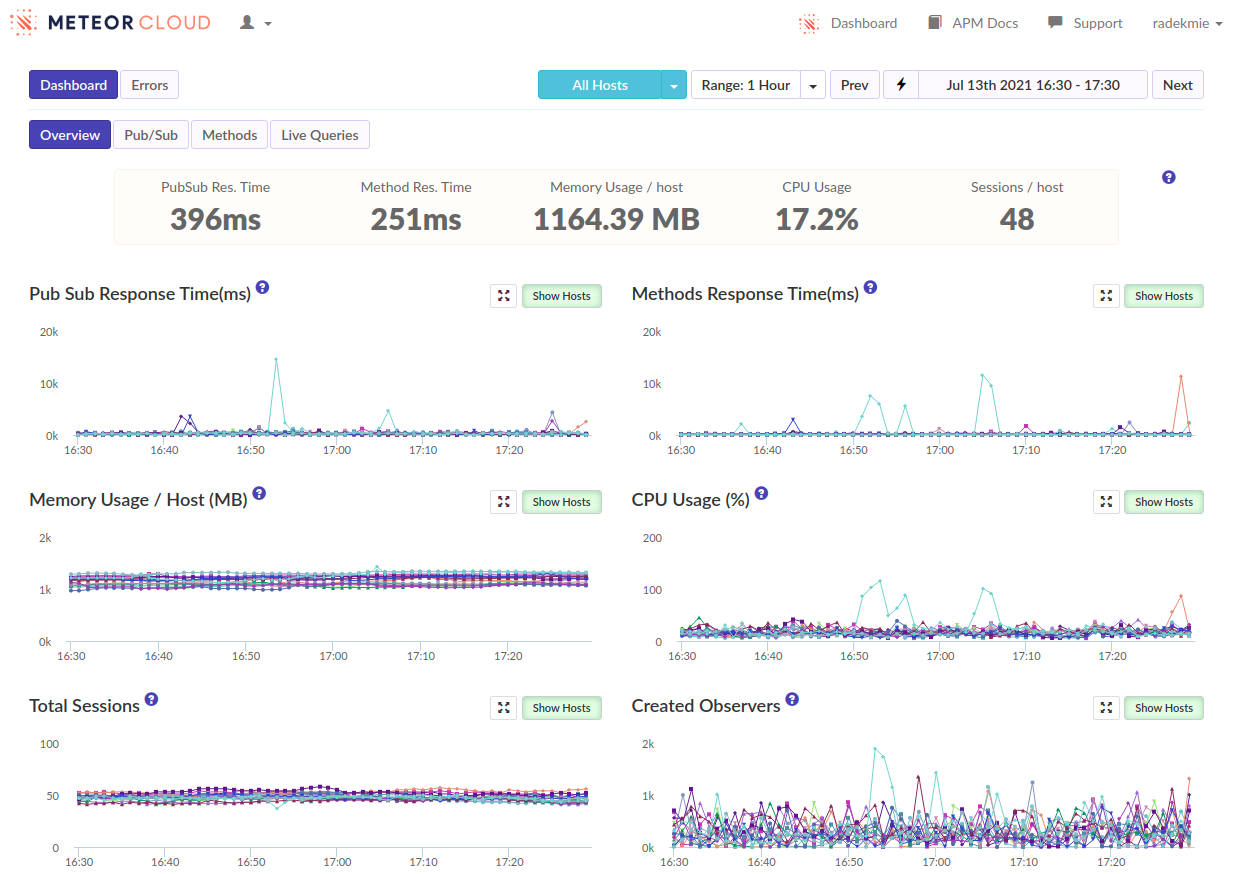
The problem
What happens is that any user loading the app load clogs the server for a couple of seconds. It’s not a problem on its own. (The CPU is there to compute things, right?) Well, in this case, the server is barely responsive if a few users load the app at once. Then, after a minute or two everything is fine again.
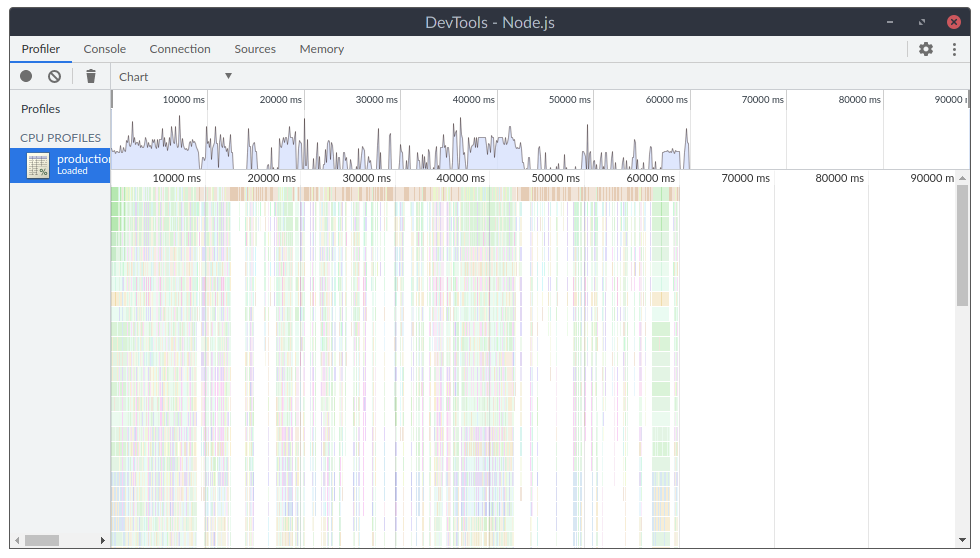
Phase I
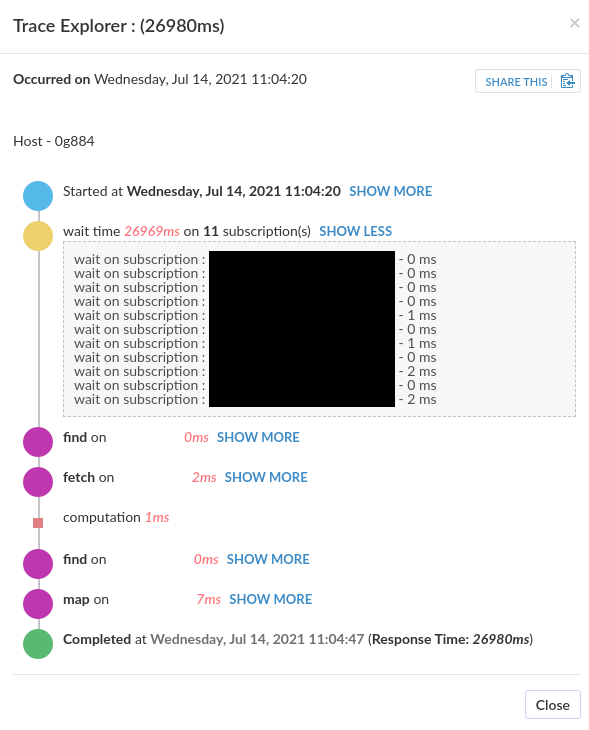
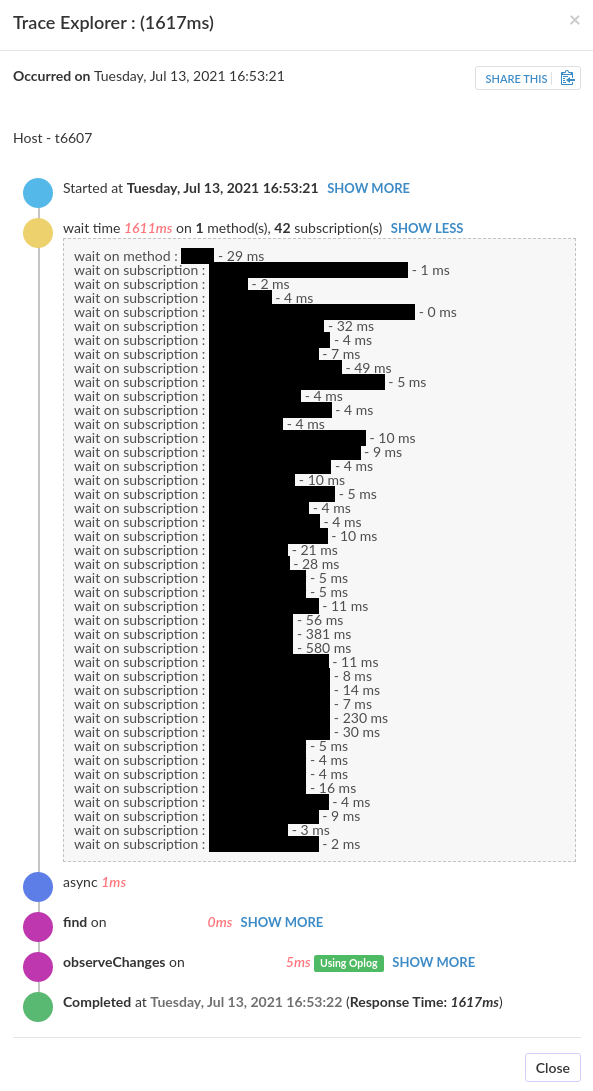
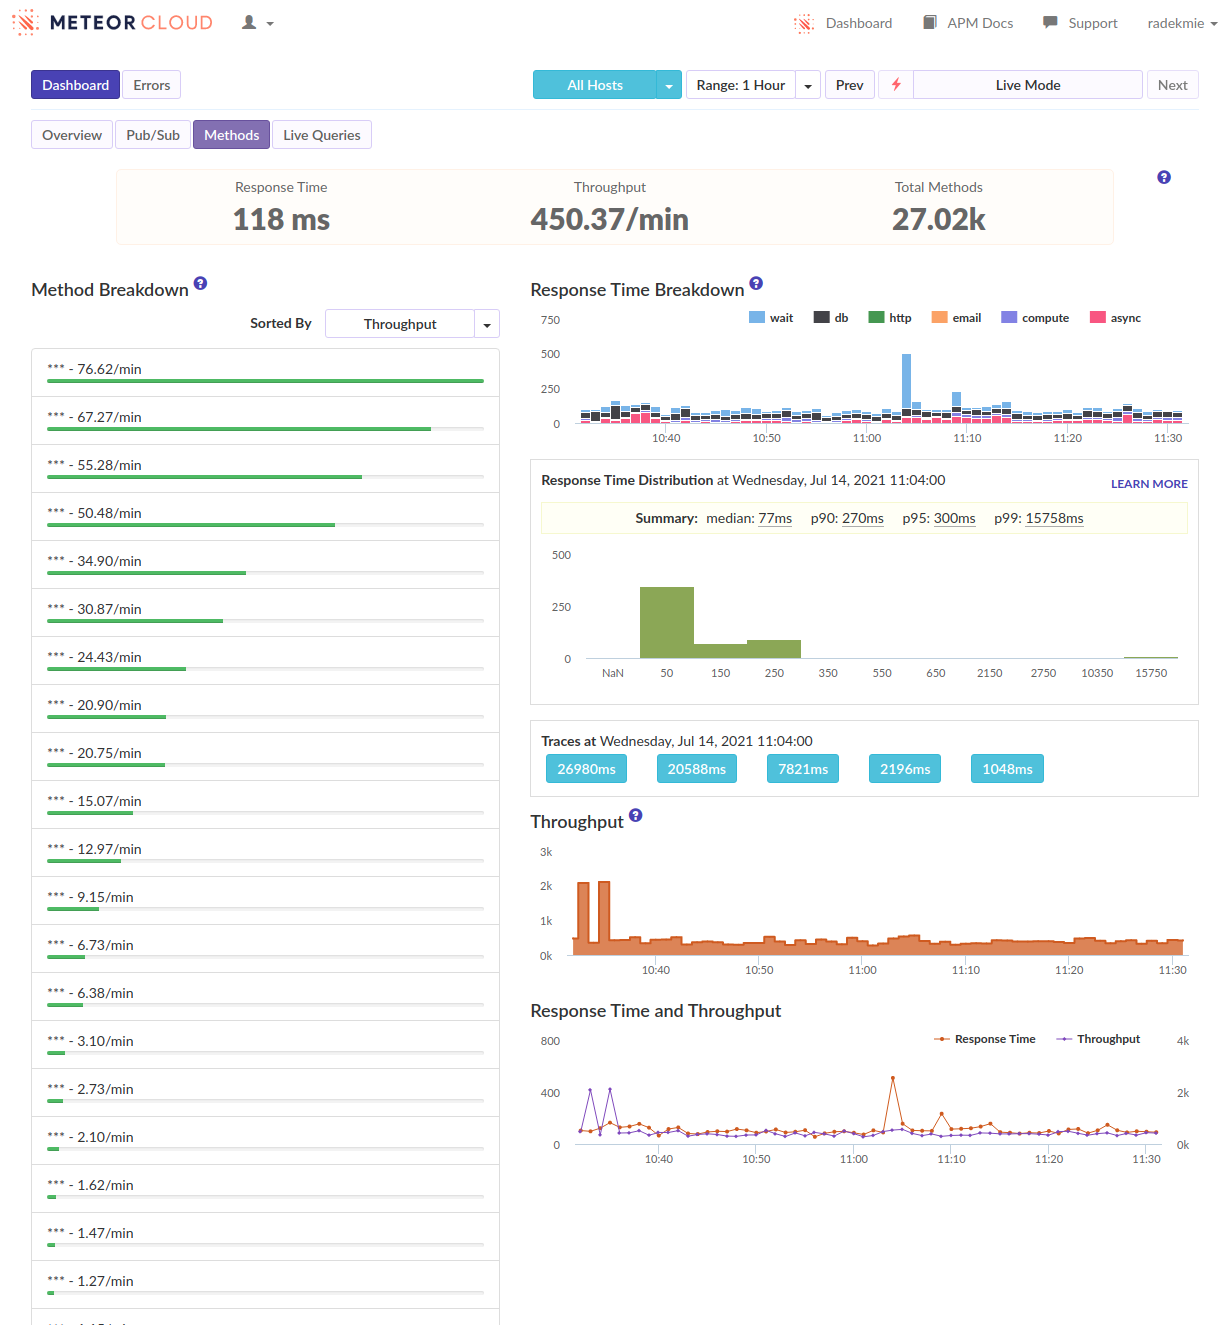
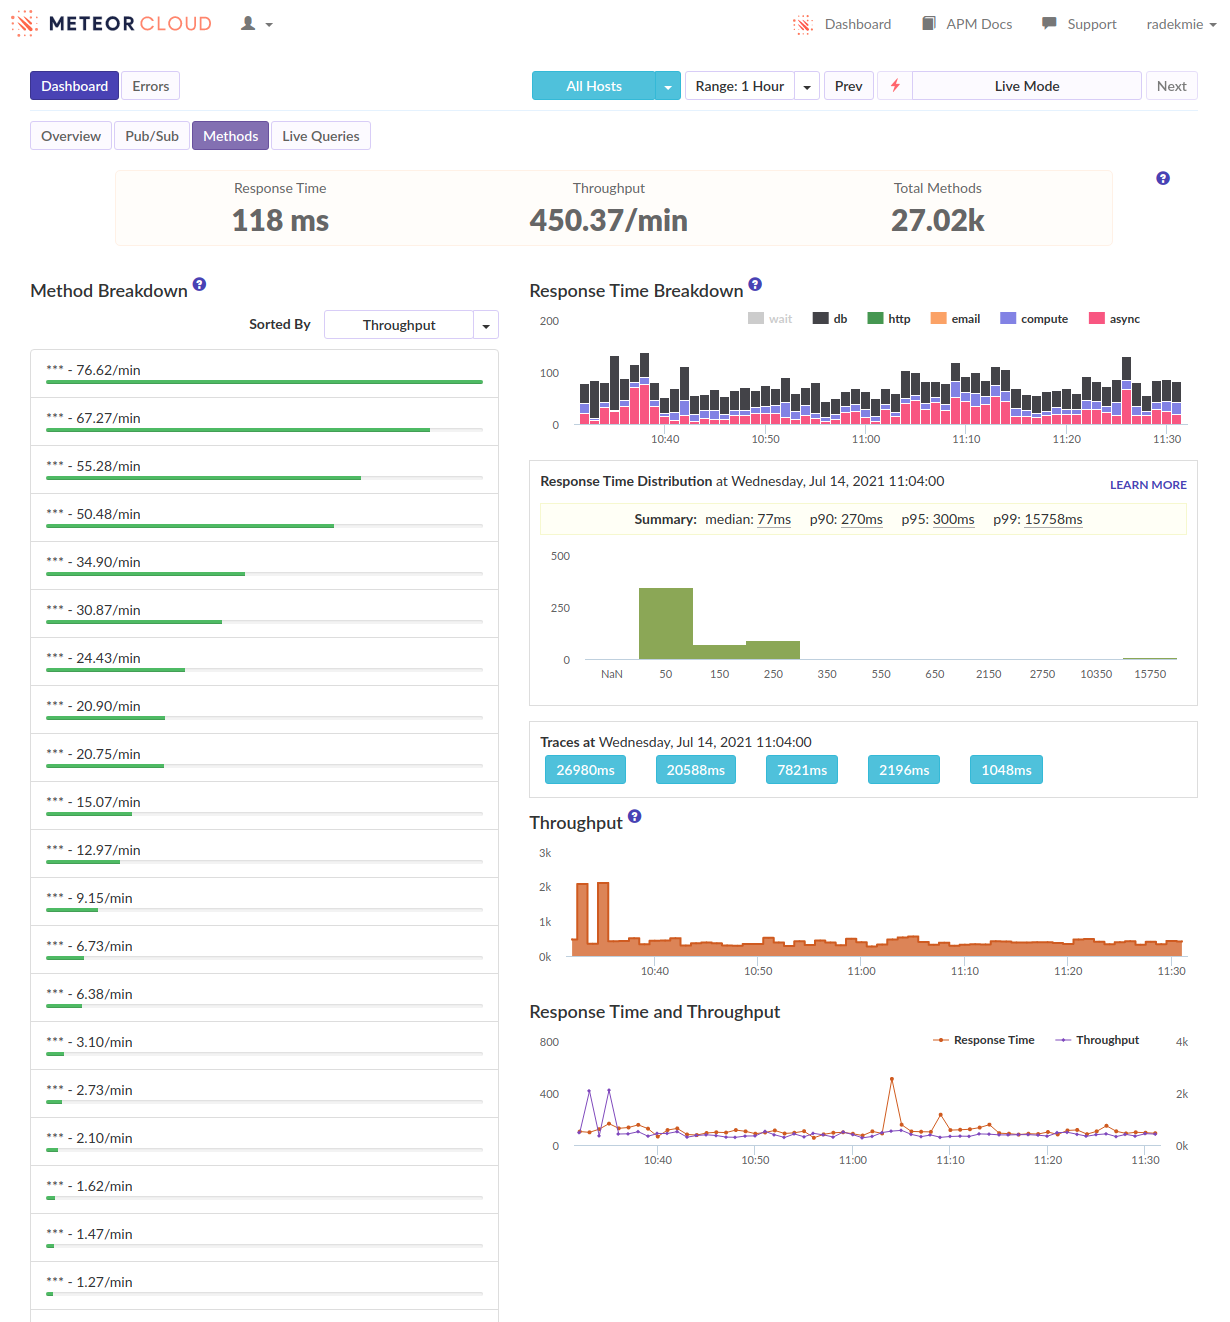
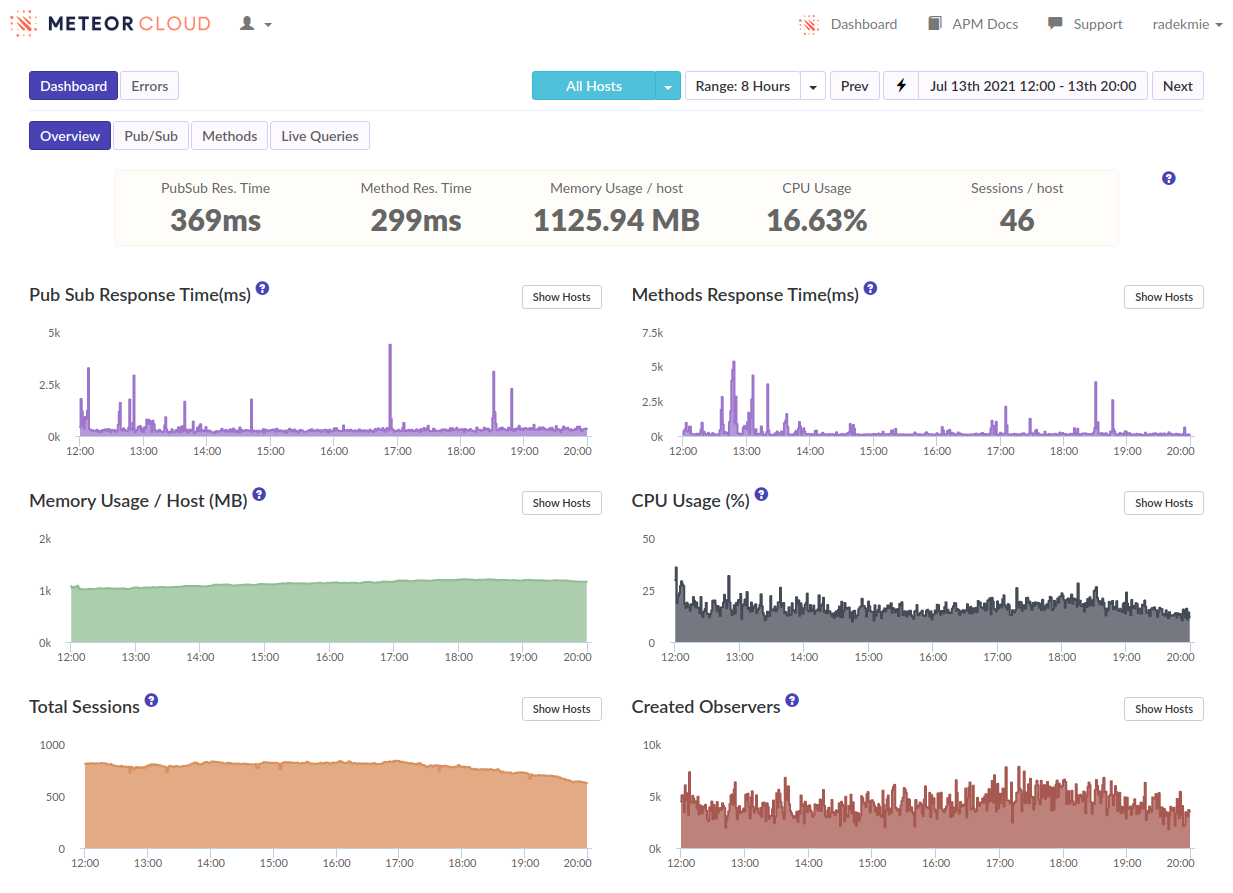
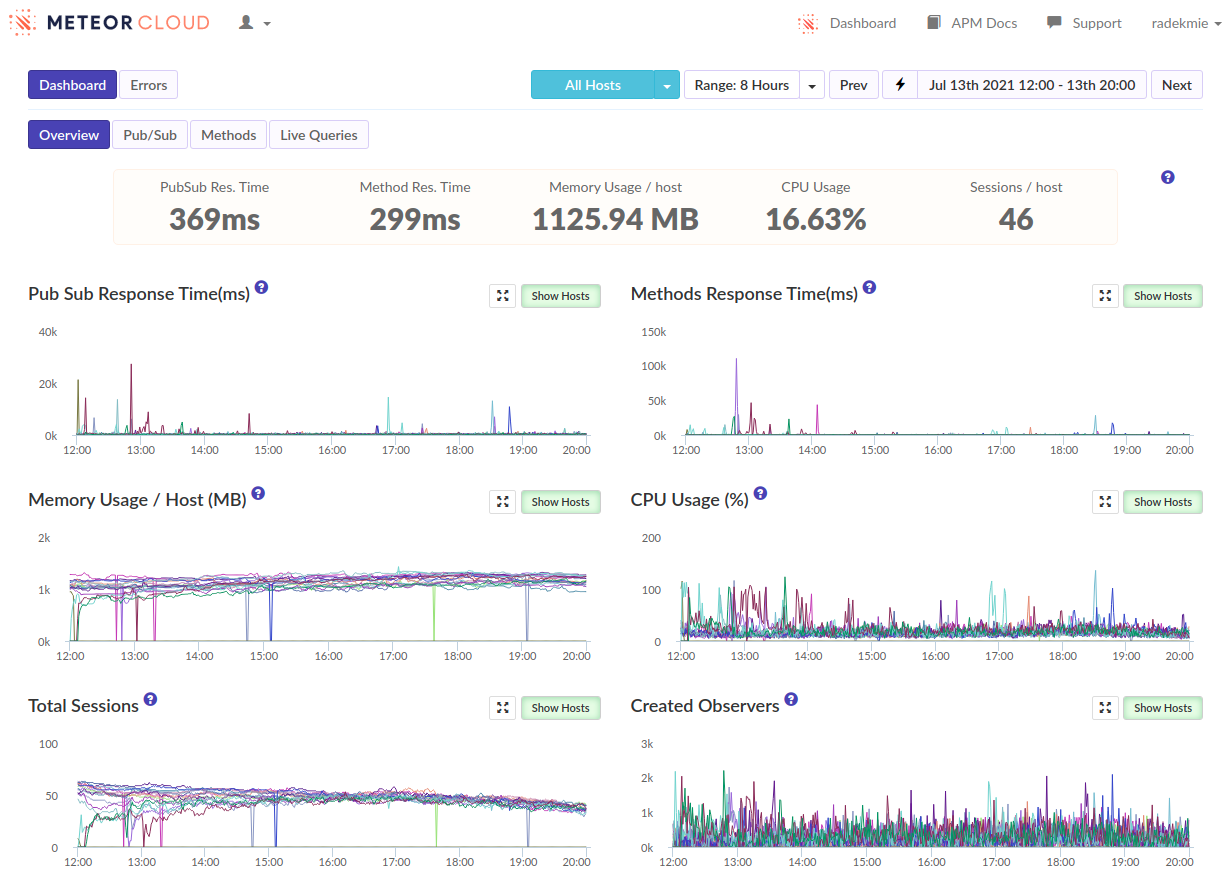
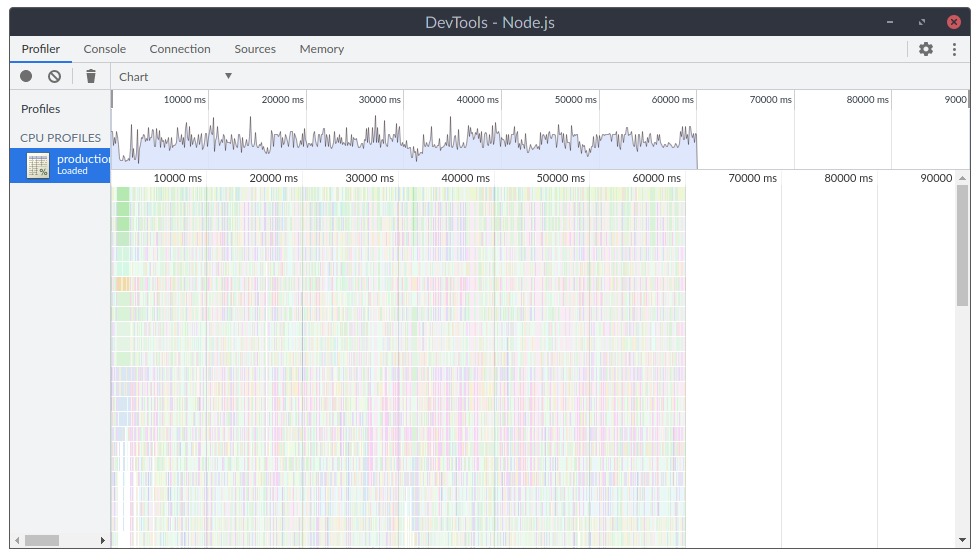
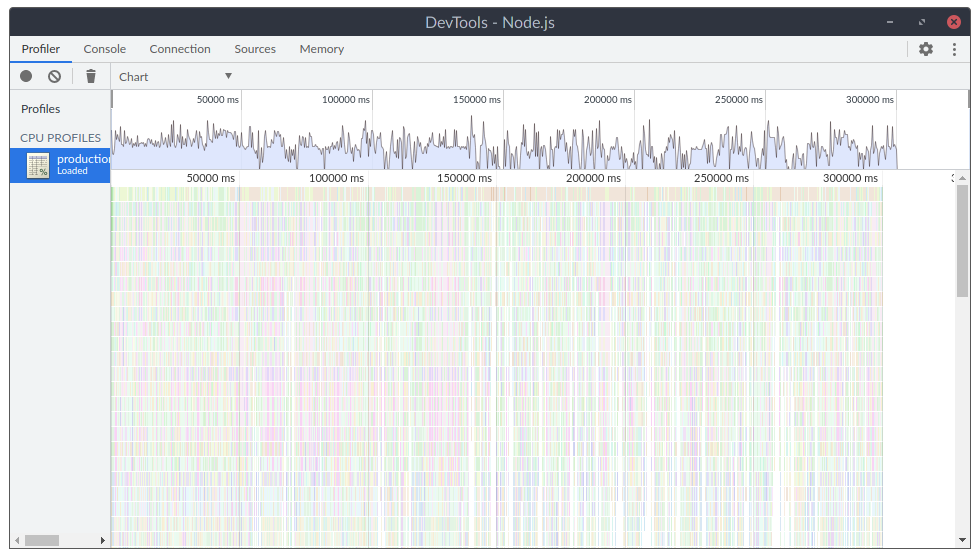
At first, we started profiling the production environment to see what’s happening. Unluckily, there was… Nothing. Nothing stood out. There was just a ton of dense series of short function calls. We quickly correlated these with users logging in. It looks like this:

Profiler results


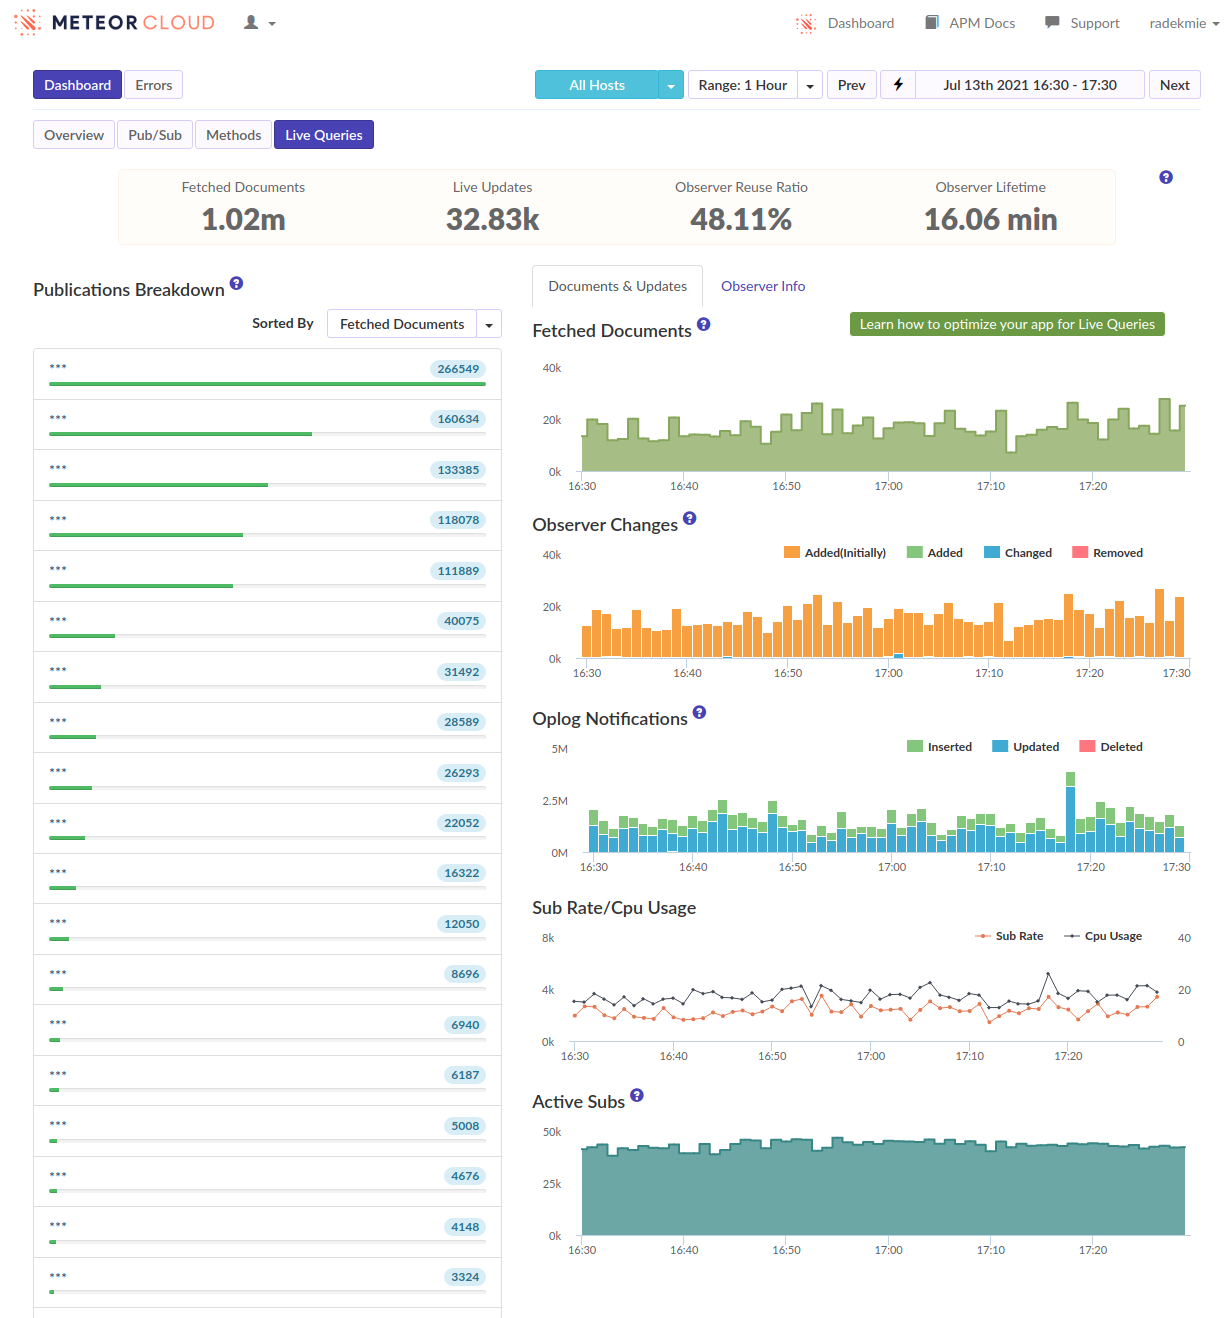
During this phase, we’ve focused on reducing the overall number of documents a user needs at all times to make these logins less disruptive. We’ve reduced it slightly, but without any significant results.

Phase II
We thought that maybe we could optimize the server “in general” to have better performance. We knew it won’t help but it bought us some time. We’ve managed to improve the overall app performance significantly, but the logins were still a problem.

Phase III
We cannot mitigate the problems, so let’s think about how we can make them less harmful. To try that, we scaled down our containers but increased their amount (we’re hosted on Galaxy). The idea was that a clogged server will impact fewer users, as they are more scattered across the machines.

In the end, it didn’t help. Smaller containers were more fragile and as a result, the number of affected users was more or less the same. (We had far more “Unhealthy containers” alerts though.)

Separately, we’ve experimented with “scattering” the publications by adding random sleep to each of them. A 0-250ms sleep to each of them helped a little but didn’t fix the problem. Additionally, it increased loading times significantly.

Phase IV
Until now, we focused solely on changes that required no business changes and were fast to try out (let’s say less than two days of work). As the problem persisted, now we wanted to think about anything that could help. What we’ve come up with:

  1. Use redis-oplog. We had a problem with setting it up as it conflicted with some of our packages. We skipped that, as it’s probably not going to help us at all – there are no problems with updates, but with the initial sync. If you are curious, the errors were dominated by this one:

    Exception in addedobserveChanges callback: Error: Can’t call yield in a noYieldsAllowed block!

  2. Normalize long arrays. As every multi-tenant system, we do store our tenantId on the documents. But we also have a feature letting different tenants sharing some of their data. In such cases, we store tenantIds instead. It all worked great for years but with the new wave of clients, we’ve noticed a couple of large tenant groups (with more than 50 tenants; one with more than 100). It’s not a problem on its own – transferring 400 * 100 IDs (Meteor IDs) every time you log in, is. Especially when the actual data makes less than 30% of the transfer. Replacing tenantIds with tenantGroupId not only got rid of a couple of GBs of data and made the app load faster, but it also made adding new tenants almost instant.

  3. Reduce the number of documents by merging them into larger ones. This one was suggested by @jkuester (thank you again!), as it helped in one of his apps. We are still investigating whether we actually can apply this to our case, but hopefully it’ll reduce the number of published documents even further.

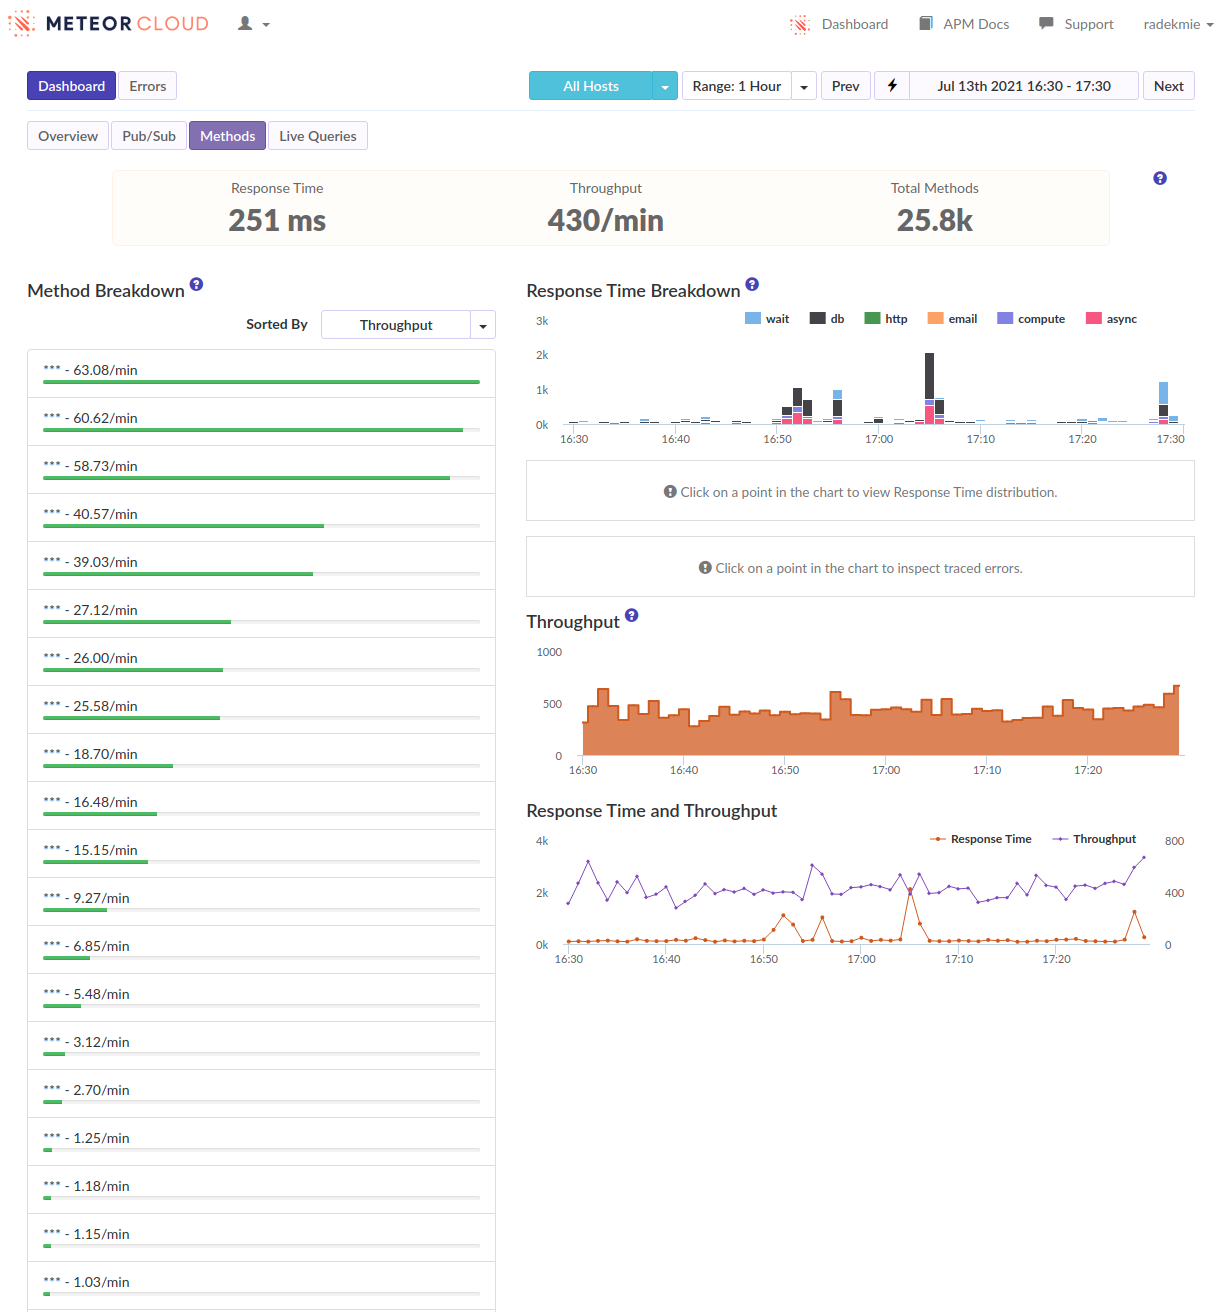
  4. Experiment with DDP batching. I’ve been observing meteor/meteor#10478 for years now. Actually, it all started with meteor/meteor#9862 and meteor/meteor#9885. Since the beginning, I was sure that it’s an important change, even if problems with Fibers will get resolved - either by fixing “Fiber bombs” or getting rid of Fibers completely. I do because it helps in cases where there are a lot messages, but all of them are relatively small… Hey, that’s exactly the problem we have now!

    To see whether this PR helps, I applied changes directly into the project and profiled the app in different settings. Overall, it helps. We still have a problem, but it’s better. I profiled the app with three parameters:

    • Batching interval (_bufferedMessagesInterval in the code; 0 means no batching).
    • Number of users logging at once (1 or 4).
    • Whether our implementation of reywood:publish-composite is enabled (we’re migrating back to this package soon). The number of documents published with and without it is similar:
      • With: 1 + 1 + 2 + 2 + 3 + 4 + 4 + 4 + 5 + 6 + 7 + 7 + 18 + 19 + 28 + 42 + 62 + 217 + 222 (654 documents in total).
      • Without: 1 + 1 + 2 + 2 + 2 + 4 + 4 + 4 + 5 + 6 + 7 + 7 + 18 + 19 + 28 + 55 + 61 + 62 + 217 + 222 (727 documents in total).
    ##   Batch   Users   Blocking   PublishComposite?
    01     0ms      1x     1200ms                  No
    02    10ms      1x      990ms                  No
    03    20ms      1x      940ms                  No
    04    50ms      1x      930ms                  No
    05   100ms      1x      970ms                  No
    06     0ms      4x     3050ms                  No
    07    10ms      4x     1740ms                  No
    08    20ms      4x     1950ms                  No
    09    50ms      4x     2030ms                  No
    10   100ms      4x     2310ms                  No
    
    11     0ms      1x     1820ms                 Yes
    12    10ms      1x     1850ms                 Yes
    13    20ms      1x     1830ms                 Yes
    14    50ms      1x     1850ms                 Yes
    15   100ms      1x     1720ms                 Yes
    16     0ms      4x     4000ms                 Yes
    17    10ms      4x     2880ms                 Yes
    18    20ms      4x     3500ms                 Yes
    19    50ms      4x     3050ms                 Yes
    20   100ms      4x     2890ms                 Yes
    

    As you can see, changing the buffering interval makes little difference, but the batching itself significantly helps. It helps much more with publish-composite disabled – that’s expected, as our implementation is synchronously waiting for related documents, effectively getting rid of batching entirely.

    I’ll comment on the PR with a link to this thread. Hopefully, we can get it merged in the nearest future. If needed, we can help with testing and making the code merge-ready. Additionally, I think a similar tactic can be applied on the client side. Batching the incoming messages would increase the chance of batching responses, especially while sending a series of unsub messages.

Phase V
We are here now. Our final idea is to write down everything and ask you for ideas. In the meantime, the problem still occurs, we are optimizing other, relatively unrelated code, just to buy more time. Most importantly, we are fine with worse performance, as long as the system remains stable.

If you’d like to look at the CPU profiles, let me know – I’d like not to share them publicly.

13 Likes

If you users don’t need the documents to be updated immediately, then you can load them via method. You can still make they feel like they are updated real-time.
Let’s say you have a collection docs, you usually have the updatedAt field, then your client can subscribe to this field only, not the whole document.
Then you use method to load the whole document data. By using this method, you can decide to add a delay time for client to load the document data. E.g 5 * Math.random() seconds. Then when you update your documents in batch, your online client won’t try to reload the documents at the same time.
Btw, by subscribe to a very few fields in collection, your server won’t have to spend lots of CPU time to compute/watch the changes.
You can even let you client subscribe to other collection instead of your docs collection, let’s say it named updates. After you updated your docs, you can update a document in updates collection to tell your client which documents have been updated. You client will use method to load them. In this case, you client will subscribe to only one document. it’s blazing fast.

4 Likes

I’d need to experiment with that, but it looks like redirecting the traffic from publications to methods. Overall the idea looks fine, I’m just worried that it’d require changing a lot of code to make it compatible.

Anyway, thanks for the suggestion!

1 Like

You can load the documents via methods then insert/update them to/in minimongo. Then other parts will be the same.

4 Likes

Interesting topic. You might want to give this package a try: GitHub - adtribute/pub-sub-lite: Lighter (Method-based) pub/sub for Meteor

As I understand, this would allow you to quickly, with minimal changes in your code, convert some existing pub/sub data loading to methods that still populate minimongo. No idea what are the tradeoffs or how fragile this might be, but it is a tool that might bring easy changes. If you give it a shot, do share your experiences.

3 Likes

Hello!
I did this package some time ago aiming to solve this exact same issue.

Initial data loading is heavy in your case.
With this package, there is a global cache on redis that will make your initial data load lighter on CPU because it will skip the mergebox, which is the main cause of burden here, and also it does populate the minimongo with data that comes from SSR. This will speed up your first page load.

It does use redis-oplog and redis-vent, so I’m not sure if you can use it as you said you have a dependency breaking it! But I would give it a try :wink:

2 Likes

I highly recommend minhna suggestion. Quite frankly, a production app with either large number of users or documents and subscriptions is a sentence where one word is wrong. Guess which one.

Try switching to method calls first, it’s not a big deal and can be done one-by-one. Start with those that hold the most docs in the subscription and are most often needed. Then work on the next in line.

This will improve your situation a lot.

For the moment I wouldn’t follow the advise of subscribing to an “update” collection and also postpone Redis Oplog. Do the easy things first, if you run into these problems again when your users are 100x from what you have now, you still have options.

Just my two cents worth

4 Likes

You have my sympathy - these are the worst types of issues to diagnose. Are you able to reliably reproduce the issue in a development environment (potentially by cloning a prod DB).

One thing to remember is that messages are gzipped on the server - this can cause quite a lot of CPU for some messages. I recently encountered an issue where we thought we were batching data (to reduce memory pressure) only to find they all got queued up waiting for gzip anyway. Some thoughts:

  1. if you send a single very large message, the server can hang while it processes it - in the above scenario we were initially trying to send 15k (smallish) documents in a single payload - having only a handful of users connected in parallel crashed the server. Batching these out to 500/batch resolved this issue (though we had to do more work to handle the aforementioned memory problems).

  2. garbage collection - if your’re remotely close to your memory limit your server will spend increasingly longer times doing GC - we recently had some servers that seemed to be having CPU load issues, we bumped the memory - no more issues!

  3. BSON parsing - make sure you aren’t requesting more data from your DB than you need, parsing these messages can be expensive, make use of aggregations where possible.

I’d be interested in seeing your CPU profiles if you dont mind sending them over

2 Likes

Here’s a bit of a crazy idea. Not sure if this will work since I’ve never tested this.

Create a separate cluster for initial client connections and connect to that cluster with a DDP.connect("my-first-login.cluster...") when the client initially loads the app. You can keep that container pool slim. After they finish their first load, swap them over to your main cluster and they will continue to use the app throughout the rest of the day on. It will allow that first cluster to absorb the CPU impact and the second one to provide the longer term experience.

I’m not sure if this will cause a resubscribe and that publication to be rerun but could be worth a try!

2 Likes

We really would need to see your Meteor APM or Monti APM info to help debug this type of thing. It would help to break down response times of methods and subscriptions to find out if the time is being spent on CPU cycles, network time, db time, etc. Last I checked Monti APM has a free tier that you can try.

A couple questions :

  • Does one user logging in slow the app for all users? Or are other users unaffected and its only slow for that one user? If it’s just slow for one user you can look into using this.unblock() and/or Meteor.defer() in methods and subscriptions to prevent one slow publication or method from blocking the ddp queue from processing the next request for that same user.
  • What is your data model? Your data model w/Mongo can make a huge difference with how you query which affects performance. If you could share your full data model, the indexes of each collection, and the queries that you’re making in your subscriptions or methods, it would be easier to help see if this is the issue.

As a side note, Meteor likes big containers because CPU usage can be high, so I’ve found that a few large servers performs better than a lot of small servers. Veritcal scaling seems to be the best bet for you.

1 Like

Definitely agree with @a4xrbj1 and @minhna. The biggest pitfall when using Meteor is the liberal use of pub/sub and this is partially due to how easy it’s to setup and use, but just because it’s available doesn’t mean it should be the default option. Pub/sub should be only used when it’s an absolute must and even then best practices should be followed like limiting the number of fields you’re returning and what not.

You should also look into using Meteor APM or Monti APM to get a more detailed understanding of what’s happening and what are the most costly parts of your code so that you can optimize first.

3 Likes

some random inputs, not sure if it helps:

@radekmie

  • I did not fully get the initial analysis. Is it because a lot of users log in at the same time or because a lot of users subscribe at the same time to a lot of documents? Could you see which functions were called a lot?

  • personally i am not sure if switching to methods is the right way in general. That removes the “realtime” aspect that you need for your app and i think if I would switch to a “method/request approach”, than i would remove DDP alltogether and use rest or graphql (you could still have a subscription channel to notify about changes).
    Having said that, if subscriptions make sense for most of your data and you have some collections that do not need to be realtime, it could make sense to load these by methods. E.g. we had translations in a meteor collection and also experienced performance problems with it, so we then loaded the translations through a method instead of a subscription

  • Concerning vertical and horizontal scaling: meteor with DDP and oplog does not scale that nicely horizontally. Its better to have more powerfull machines instead of having more containers.

  • One aspect that does not match your case, but which was surprising to me (and painful…): Careful when updating a lot of documents at the same time regularly. Updating a lot of documents, e.g. in a loop will inform all containers (pods) that have open subscriptions about updates and will cause cpu usage on all containers, because they have to process these messages. Solution is to use disableOplog: true on subscriptions that need this data. They will poll the db instead, which might be better in cases where the data will change anyway regularly (you can customize the polling interval with pollingIntervalMs). this is also true if you use redis-oplog.

2 Likes

I’m running a production site on Google Cloud with Google load balancing, instances group (auto scaling), mongodb replicaset, redit oplog. It works.

Huh?

It cannot get more realtime then firing off a method call just when you need fresh data (eg when you switch to a new route).

On the contrary, I do believe that pub/sub is slower every freaking time!

That is our experience when we did the switch and we never looked back at using pub/sub every since. Just seeing how much faster our app is and the positive comments from our users is enough reason.

I fully agree with that view, excellent quote

4 Likes

I would avoid Meteor for real time at scale.

My experiences from 5 years ago:

Since then I’ve moved away from Meteor.

It cannot get more realtime then firing off a method call just when you need fresh data (eg when you switch to a new route).

that is not what is meant with “realtime”. In the context of meteor and webapplications we understand “realtime” as getting changes on the domain state as soon as possible on the client. Loading data on route change is trivial and you don’t need DDP for that. This has been done since the dawn of the www.

But i would also argue that often you don’t need the realtimeness of pub/sub as it comes with a significant cost

1 Like

yeah, we do that too. But standard meteor is still very memory / cpu intensive and profits from better hardware. Horizontal scaling with meteor needs a lot of work, e.g. when using redis-oplog, you need to be careful when you do a lot of updates regularly as it will inform ALL pods/containers about update unless you use channels. But having channels just adds another layer of complexity. So yes, of course, you can make it work, but at what cost? The very existence of redis-oplog is an alarming sign in my opinion and should have been integrated into meteor itself or made obsolte by a better approach in meteor core.

Also having more instances adds load to the mongodb, which will be your next bottleneck as @elie s blogpost also states.

I just wanted to give a warning, because I went through a lot of pain and i am a bit worried that the reports of scaling problems with meteor still pop up regularly. Tiny should tackle these problems in my opinion and at least make clear statements what to do and what not to do.

2 Likes

Just a note, the disableOplog: true option is a flag to be passed to collection.find. @radekmie did you already tried to use this flag in said publications? I think the described use-case is similar to yours:

2 Likes

Wow, that’s a lot of feedback! Thank you all! I let myself comment on all of them in one comment not to spam too much. I’ll also skip some parts of your comments if the answer is already there.

@minhna
You can load the documents via methods then insert/update them to/in minimongo. Then other parts will be the same.

That’d require a lot of client-side changes to make sure that all of the code is using the local, method-populated collection. Again, an interesting idea, though a hard one to implement in a huge app.

@vooteles
Interesting topic. You might want to give this package a try: adtribute/pub-sub-lite

I saw that some time ago. It was also proposed by @jkuester. The problem is that it does not support any real-time updates. I may, however, experiment with pooling using this method.

@renanccastro
I did this package some time ago aiming to solve this exact same issue.

I’ll definitely try it if we’ll ever use redis-oplog!

@znewsham

  1. if you send a single very large message, the server can hang while it processes it […]
  2. garbage collection […]
  3. BSON parsing […]
  1. We have the exact opposite problem - we do send a lot of small messages. There are some large ones, but they do not correlate with the CPU spikes at all.
  2. We are at ~12% (~1GB) of RAM almost constantly. That’s far under the default limit (~1.3GB) and we do use --max-old-space-size=3072 anyway.
  3. It is the case with these larger messages from 1., originating from our extensive usage of aggregations. Again, it does not correlate with the CPU spikes.

@don1231
Here’s a bit of a crazy idea. Not sure if this will work since I’ve never tested this.

I’m not sure how to implement it at all. Meteor has to populate the merge box on the server anyway and it’s probably not possible to do it from the client side (the already downloaded data). If you’d have an idea on how to do that - let me know! (We’re hosted on Galaxy - it may be a little problem with separate cluster.)

@efrancis
We really would need to see your Meteor APM or Monti APM info to help debug this type of thing. […]
Does one user logging in slow the app for all users? […]
What is your data model? […] If you could share your full data model, […].
As a side note, Meteor likes big containers because CPU usage can be high, so I’ve found that a few large servers performs better than a lot of small servers.

  1. Of course, I’ll attach them at the end.
  2. It doesn’t make the app slow at all. The app is unresponsive at all, for a couple seconds. And no, not for all users, but for all on the same container.
  3. It’s highly normalized with occasional denormalization of rarely changing data. I can’t share the full data model because of the business agreements, as well as the fact that’s far too large to analyze here (>60 collections).
  4. We are currently using Galaxy’s Octa servers (8.3 ECU) - these are already quite strong. However, I do agree with the comments from Galaxy performance vs AWS - it feels like these Galaxy units are somehow limited.

@macrozone
[…] Is it because a lot of users log in at the same time or because a lot of users subscribe at the same time to a lot of documents? […]
[…] Careful when updating a lot of documents at the same time regularly. […] Solution is to use disableOplog: true on subscriptions that need this data. […]

  1. Neither. The problem occurs when certain users (with relatively high number of documents) log in.
  2. We’ve never had problems with that as the number of inserts/updates/deletes in our case is relatively low.
  3. I’ve tried enabling disableOplog: true for all publications. It did not affect the loading time in anyway, both on client and server.

Here’s a couple of APM screens (highly censored, sorry).

Screenshots

We have quite a few of such weird method and publication traces. My guess is that the CPU is so busy, that it actually affects the APM metrics.

A standard one looks fine.

Data from today.


Data from yesterday.


Broader scale.


2 Likes

Lots of interesting ideas but I want to suggest you focus on finding the root cause before trying solutions.

This will be difficult but try to put together a test case that reproduces this reliably in a test environment. Use selenium web driver to simulate multiple clients and perhaps AWS instances for clients. Once you have the issue reproducing in test env, focus on profiling the server and client and finding what part is so slow on login. You may need to do process of elimination to see if you remove a part, stuff starts working as expected. When you have the root cause, solving will then be possible.

2 Likes